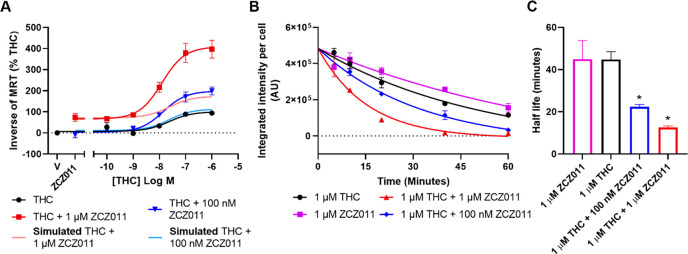
Figure 4.
Internalization of CB1 induced by cannabinoid ligands in HEK293-hCB1 cells. (A) Kinetic concentration–response data were analyzed by MRT (see Methods) and are presented as 1/MRT, where data has been normalized to the response of THC alone and pooled across five independent biological replicates (n = 5). (B) Kinetic hCB1 internalization responses to high drug concentrations, presented over 60 min, where representative data are expressed as mean ± SD of technical duplicates (n = 5 data are shown in Table 4). (C) Internalization half-lives are expressed as mean ± SEM of five independent biological replicates (n = 5). * indicates a significant difference when compared to 1 μM THC.

