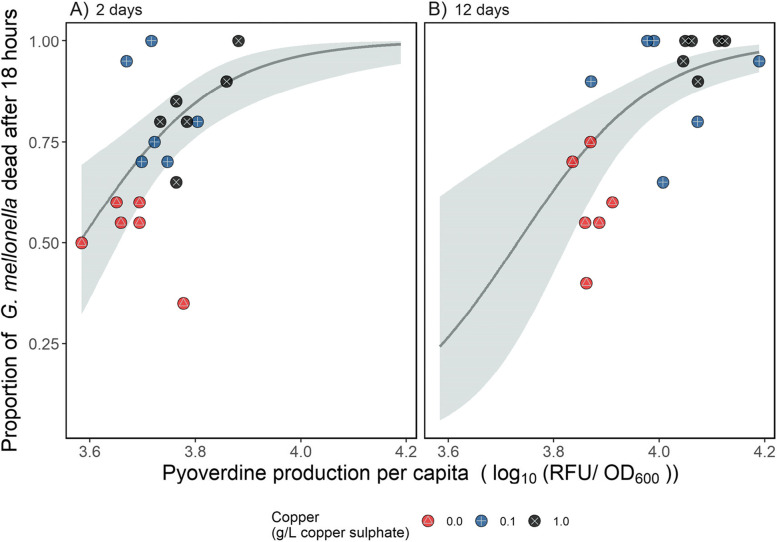
Fig. 4.
The relationship between per capita pyoverdine production (log10-transformed relative fluorescence units per OD600) and virulence of P. aeruginosa populations grown with copper for (A) two days + one day in the absence of copper, or (B) twelve days + one day in the absence of copper. Virulence was quantified using the Galleria mellonella infection model and expressed as the proportion of G. mellonella dead (out of 20) 18 h after injection. Individual replicates are represented by circles (n = six per treatment); red points containing a △ represent the control (no copper) treatments, blue points containing a + the low copper treatment, and black points containing a ✕ the high copper treatment. The line shows the best model fit, and the shaded area shows the 95% confidence interval

