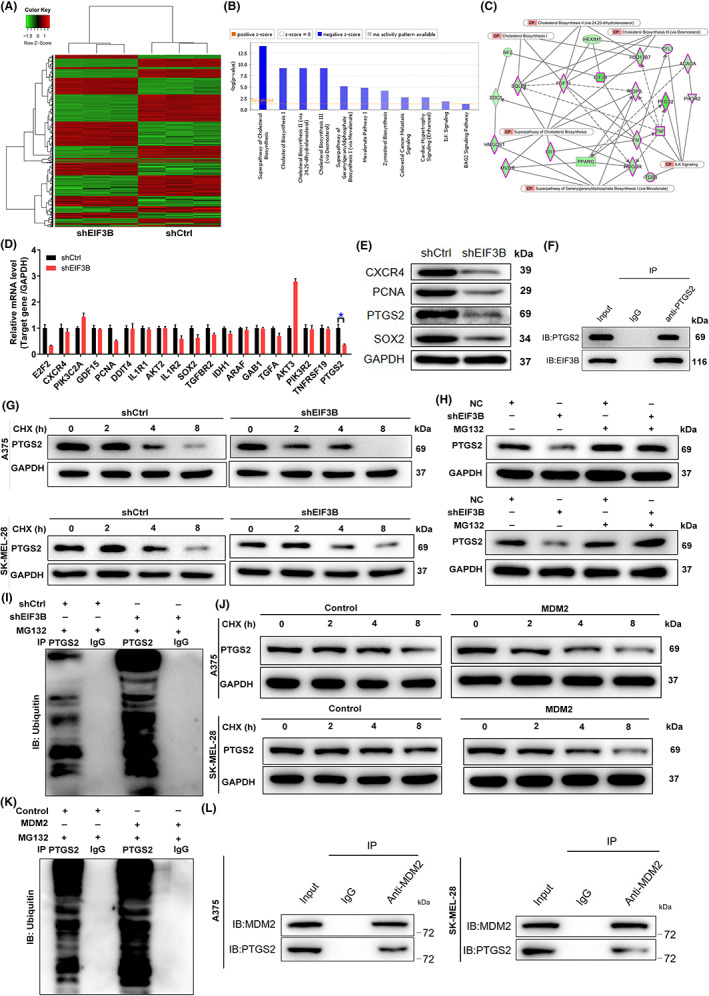
FIGURE 4.

Exploration and verification of the underlying mechanism of EIF3B regulating malignant melanoma. A, Heatmap of differentially expressed genes (DEGs) identified by RNA sequencing of A375 cells treated with shCtrl (n = 3) or shEIF3B (n = 3). B, The enrichment of the DEGs in canonical signaling pathways was analyzed by ingenuity pathway analysis (IPA). C, Interaction network diagram between DEGs was analyzed by IPA. D, E, The expression of several of the most significant DEGs identified by qRT‐PCR (D) and Western blot (E) in A375 cells with shEIF3B. The experiments were performed in triplicate. F, Co‐immunoprecipitation (co‐IP) assay was used to verify whether there was protein interaction between EIF3B and PTGS2. G, The protein levels of PTGS2 in EIF3B‐depleted A375 and SK‐MEL‐28 cells were measured after 0.2 mg/ml CHX treatment for the indicated times. H, After treatment with MG‐132, the protein levels of PTGS2 in EIF3B‐depleted A375 and SK‐MEL‐28 cells were measured. I, The lysates of EIF3B‐depleted A375 cells were subjected to immunoprecipitation, and Western blotting (WB) was performed to examine the ubiquitination of PTGS2. J, The protein levels of PTGS2 in MSM2‐rich A375 and SK‐MEL‐28 cells were measured after 0.2 mg/ml CHX treatment for the indicated times. K, The lysates of MDM2‐rich A375 cells were subjected to immunoprecipitation, and WB was performed to examine the ubiquitination of PTGS2. L, co‐IP analysis of the interaction between PTGS2 and MDM2 in A375 and SK‐MEL‐28 cells. The data are expressed as the mean ± SD (n ≥ 3), *p < 0.05, **p < 0.01, ***p < 0.001
