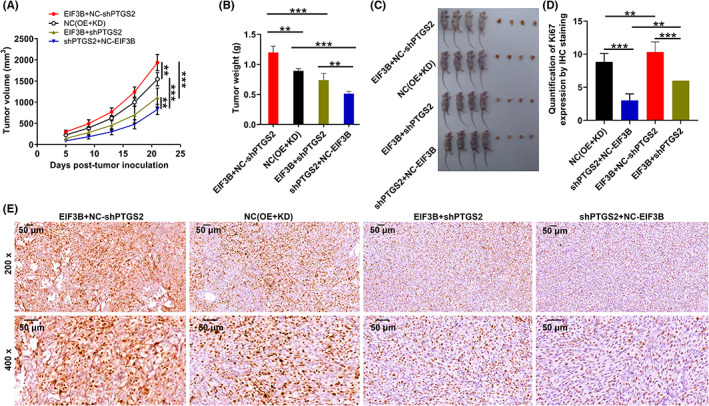
FIGURE 6.

The effects of the EIF3B‐PTGS2 axis in malignant melanoma tumor growth. A, B, The volume (A) and weight (B) of tumors from mice of the NC, EIF3B, shPTGS2, and EIF3B + shPTGS2 groups were checked from feeding to sacrifice. C, After sacrificing mice, the obtained tumors were weighed and photographed. D, E, The value of Ki‐67 was detected by IHC analysis in tumor sections from mice of the NC, EIF3B, shPTGS2, and EIF3B + shPTGS2 groups. Magnification: 200×, 400×. Results are presented as mean ± SD. ***p < 0.001
