
FIGURE 7.
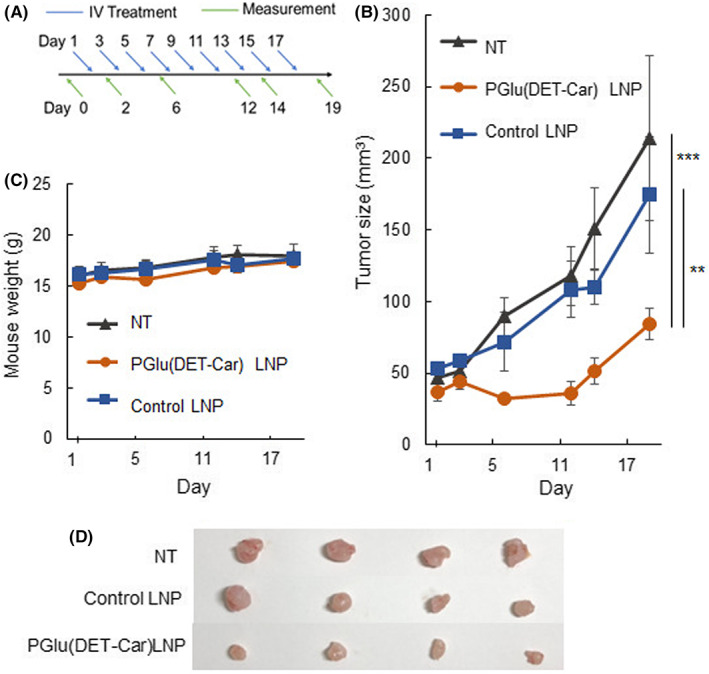
Tumor suppression effect. (A) Scheme of the therapeutic regimen. (B) Tumor suppression effect and (C) mouse body weight change during periodic i.v. administration of siPLK1‐loaded LNPs. Each point is expressed as the mean ± SEM (n = 4), ** p < 0.01, and *** p < 0.001 (two‐way anova with Tukey's multiple comparisons test). (D) Snapshots of the tumor in the SKOV3‐luc subcutaneous model on the final day