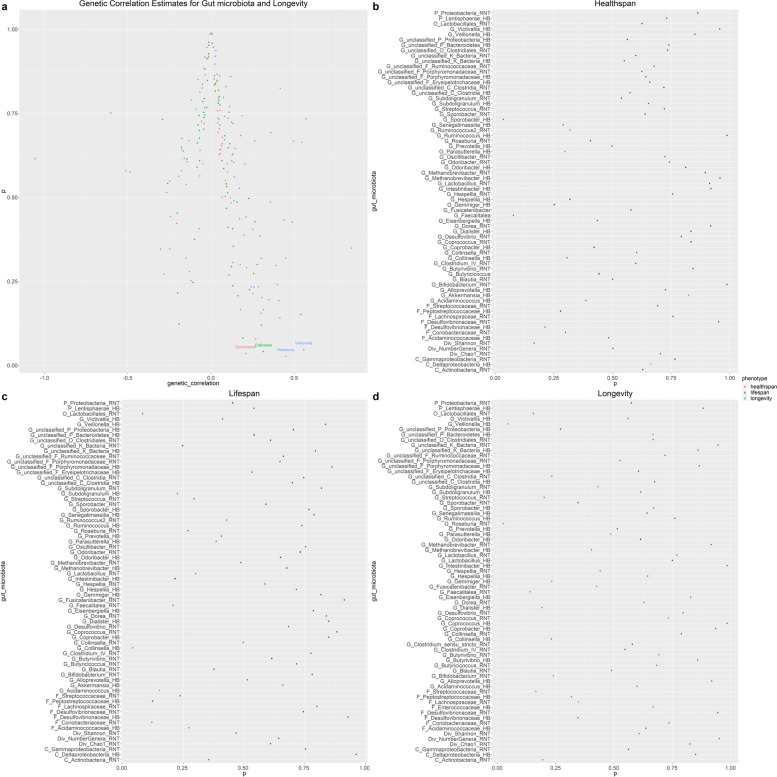
Fig. 3.
Genetic correlation estimates for gut microbiota and longevity by LDSC regression analysis. a Circle color indicates the phenotype of longevity, whilethe red plot represents the healthspan, the green plot represents the parental lifespan,and the blue plot represents the parental longevity.Geneticcorrelation estimates with P<0.05 were annotated in the figure. All the genetic correlationsfor gut microbiota and longevity illustrated here can be found in Supplementary Table 2. b, c, d Circles represent the genetic correlation of healthspan, lifespan and longevity, respectively. The circle color indicates the degree of genetic correlation. The dark color has a high degree of genetic correlation, while the light color has a low degree of genetic correlation

