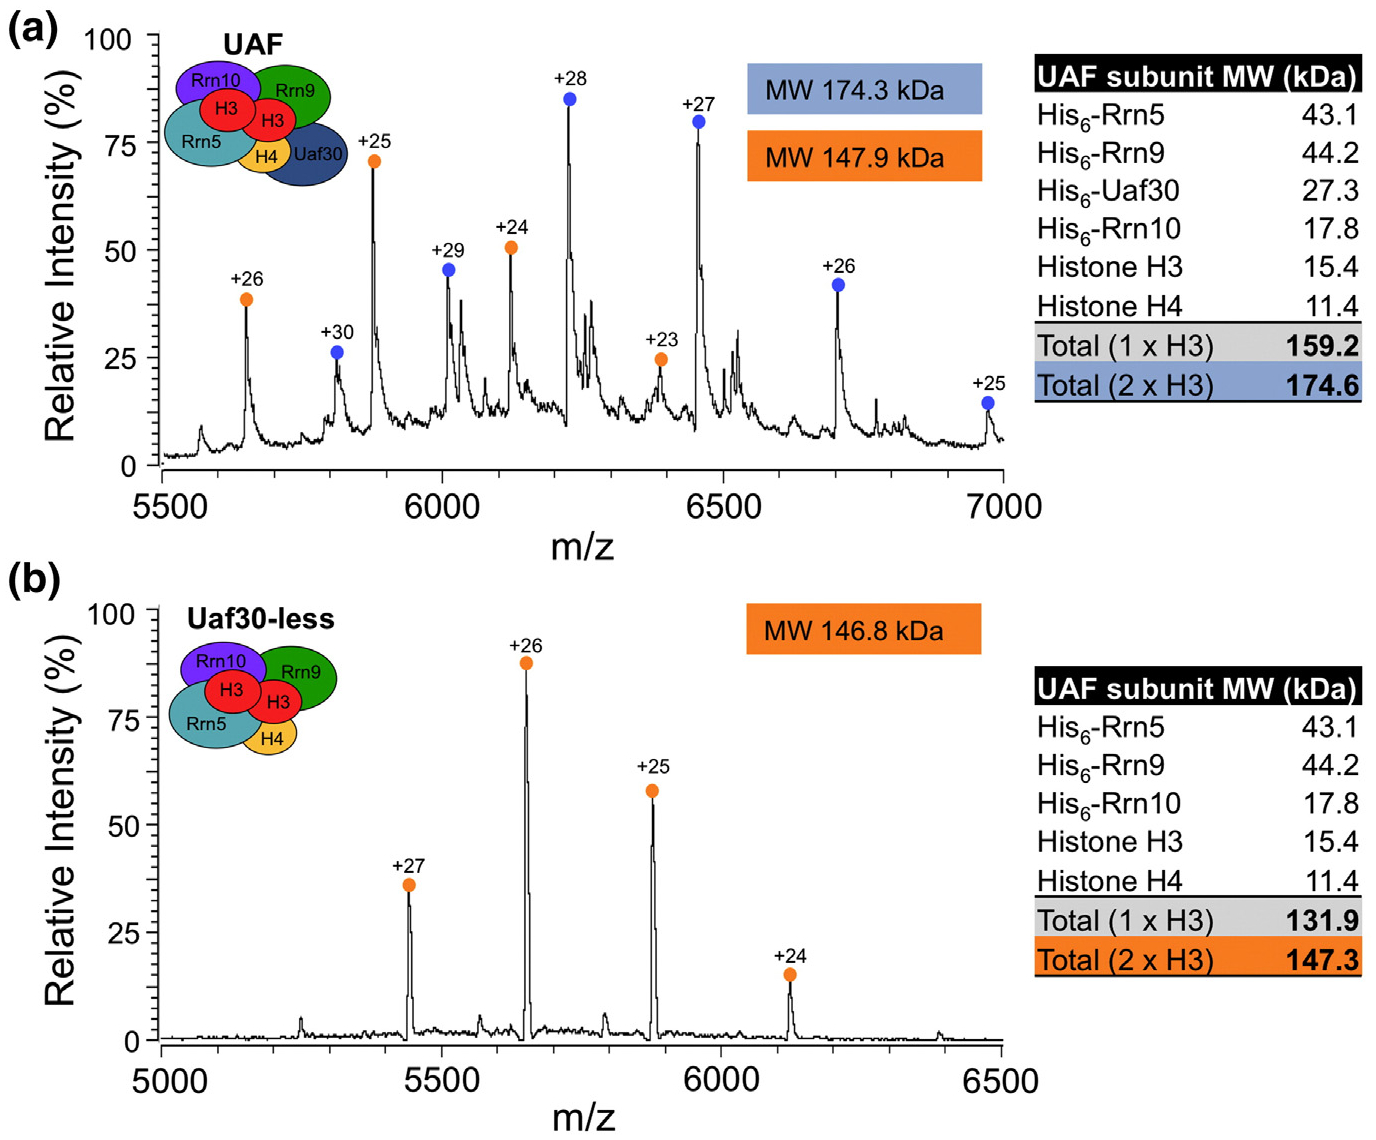
Fig. 7.

ESI-MS analysis of UAF. Native mass spectra of UAF (a) or Uaf30-less UAF (b) are shown. The UAF and Uaf30-less UAF charge state distributions are noted with blue and orange circles, respectively. The charge states are listed above their corresponding peaks. The deconvoluted molecular weights (kDa) of the complexes are shown as light blue and orange colored boxes within the mass spectrum. The theoretical molecular weights of each UAF subunit and complexes containing single or two copies of histone H3 are listed in a table to the right of the mass spectra.
