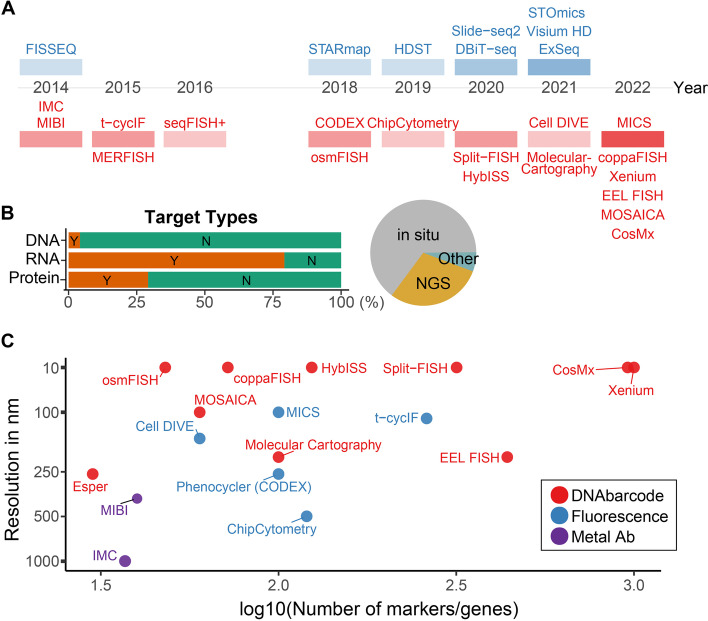
Fig. 2.
Timeline, type, and specifications of spatial omics technologies. A Timeline of all super resolution methodologies from 2010. Color intensity corresponds to the number of technologies published each year, and blue colored techniques are sequencing-based while red colored techniques are multiplexed IHC/IF methodologies. Top and bottom of the red boxes represent non-FISH and FISH based, respectively. B Proportions of target types and analysis approaches, where Y quantifies methods detecting given analyte (DNA, RNA, or protein). C Comparison of imaging-based technologies. Highest resolution that can be done, some of the super resolution microscopy-based methods were estimated at 50 nm and maximum number of the markers or genes that can be detected in an experiment. Note that depending on the technology, some of them were not optimized yet and can be expanded in future years. Excluded seqFISH + and MERFISH which claims up to 10,000 markers for detection (probe-based method)

