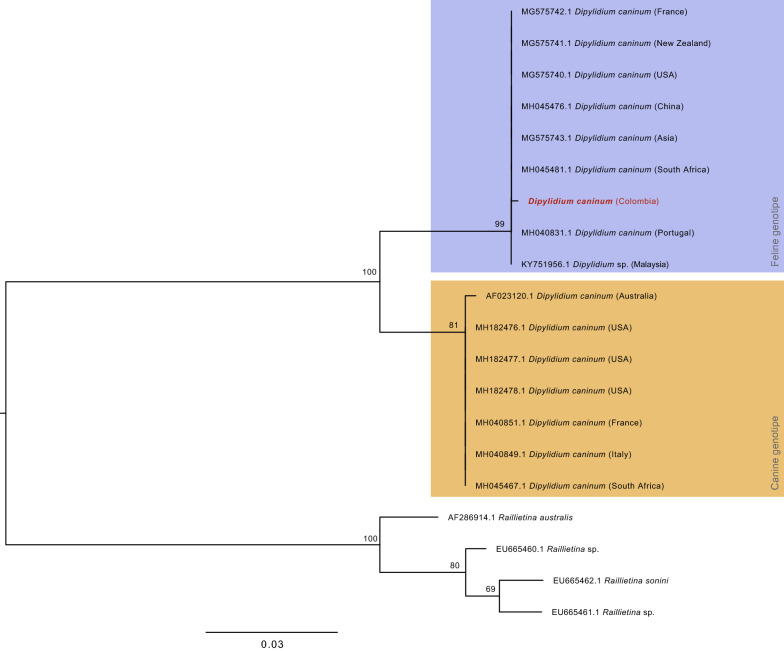
Fig. 2.
Phylogenetic tree with the highest log likelihood (- 1067.18), obtained from phylogenetic analysis of 28S sequences of Dipylidium caninum and Raillietina sp. (Table 1). The tree was built using the maximum likelihood method and the Tamura-Nei model [33]. The phylogeny is drawn to scale, with branch lengths measured in the number of substitutions per site; bootstrap values are shown above each branch. Each specimen is identified by its GenBank accession number, species name and the country where it was collected. The sequence obtained from the Colombian specimen of this study is highlighted in red. Additionally, the two clades formed by the feline and canine genotypes are shown in purple and yellow, respectively

