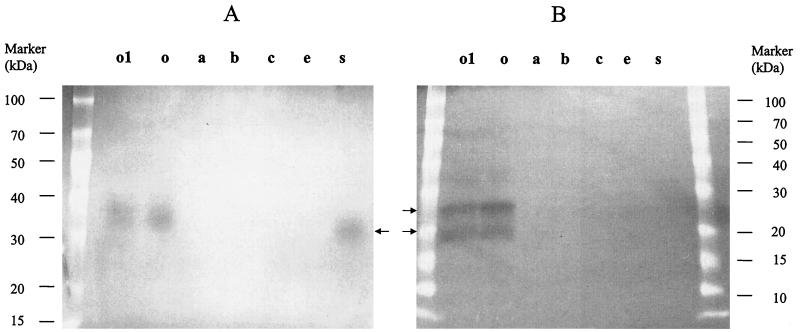
FIG. 3.
Gelatinase and serine protease activities in fsr and sprE mutants. These pictures are the negative images of gelatin and casein zymogram gels. (A) Gelatinase activity of mutants on gelatin zymogram gel. (B) Serine protease activity of mutants on casein zymogram gel. Lanes: o1, mutant with disruption of orf1; o, OG1RF; a, mutant with disruption of fsrA; b, mutant with disruption of fsrB; c, mutant with disruption of fsrC; e, mutant with disruption of gelE; s, mutant with disruption of sprE.

