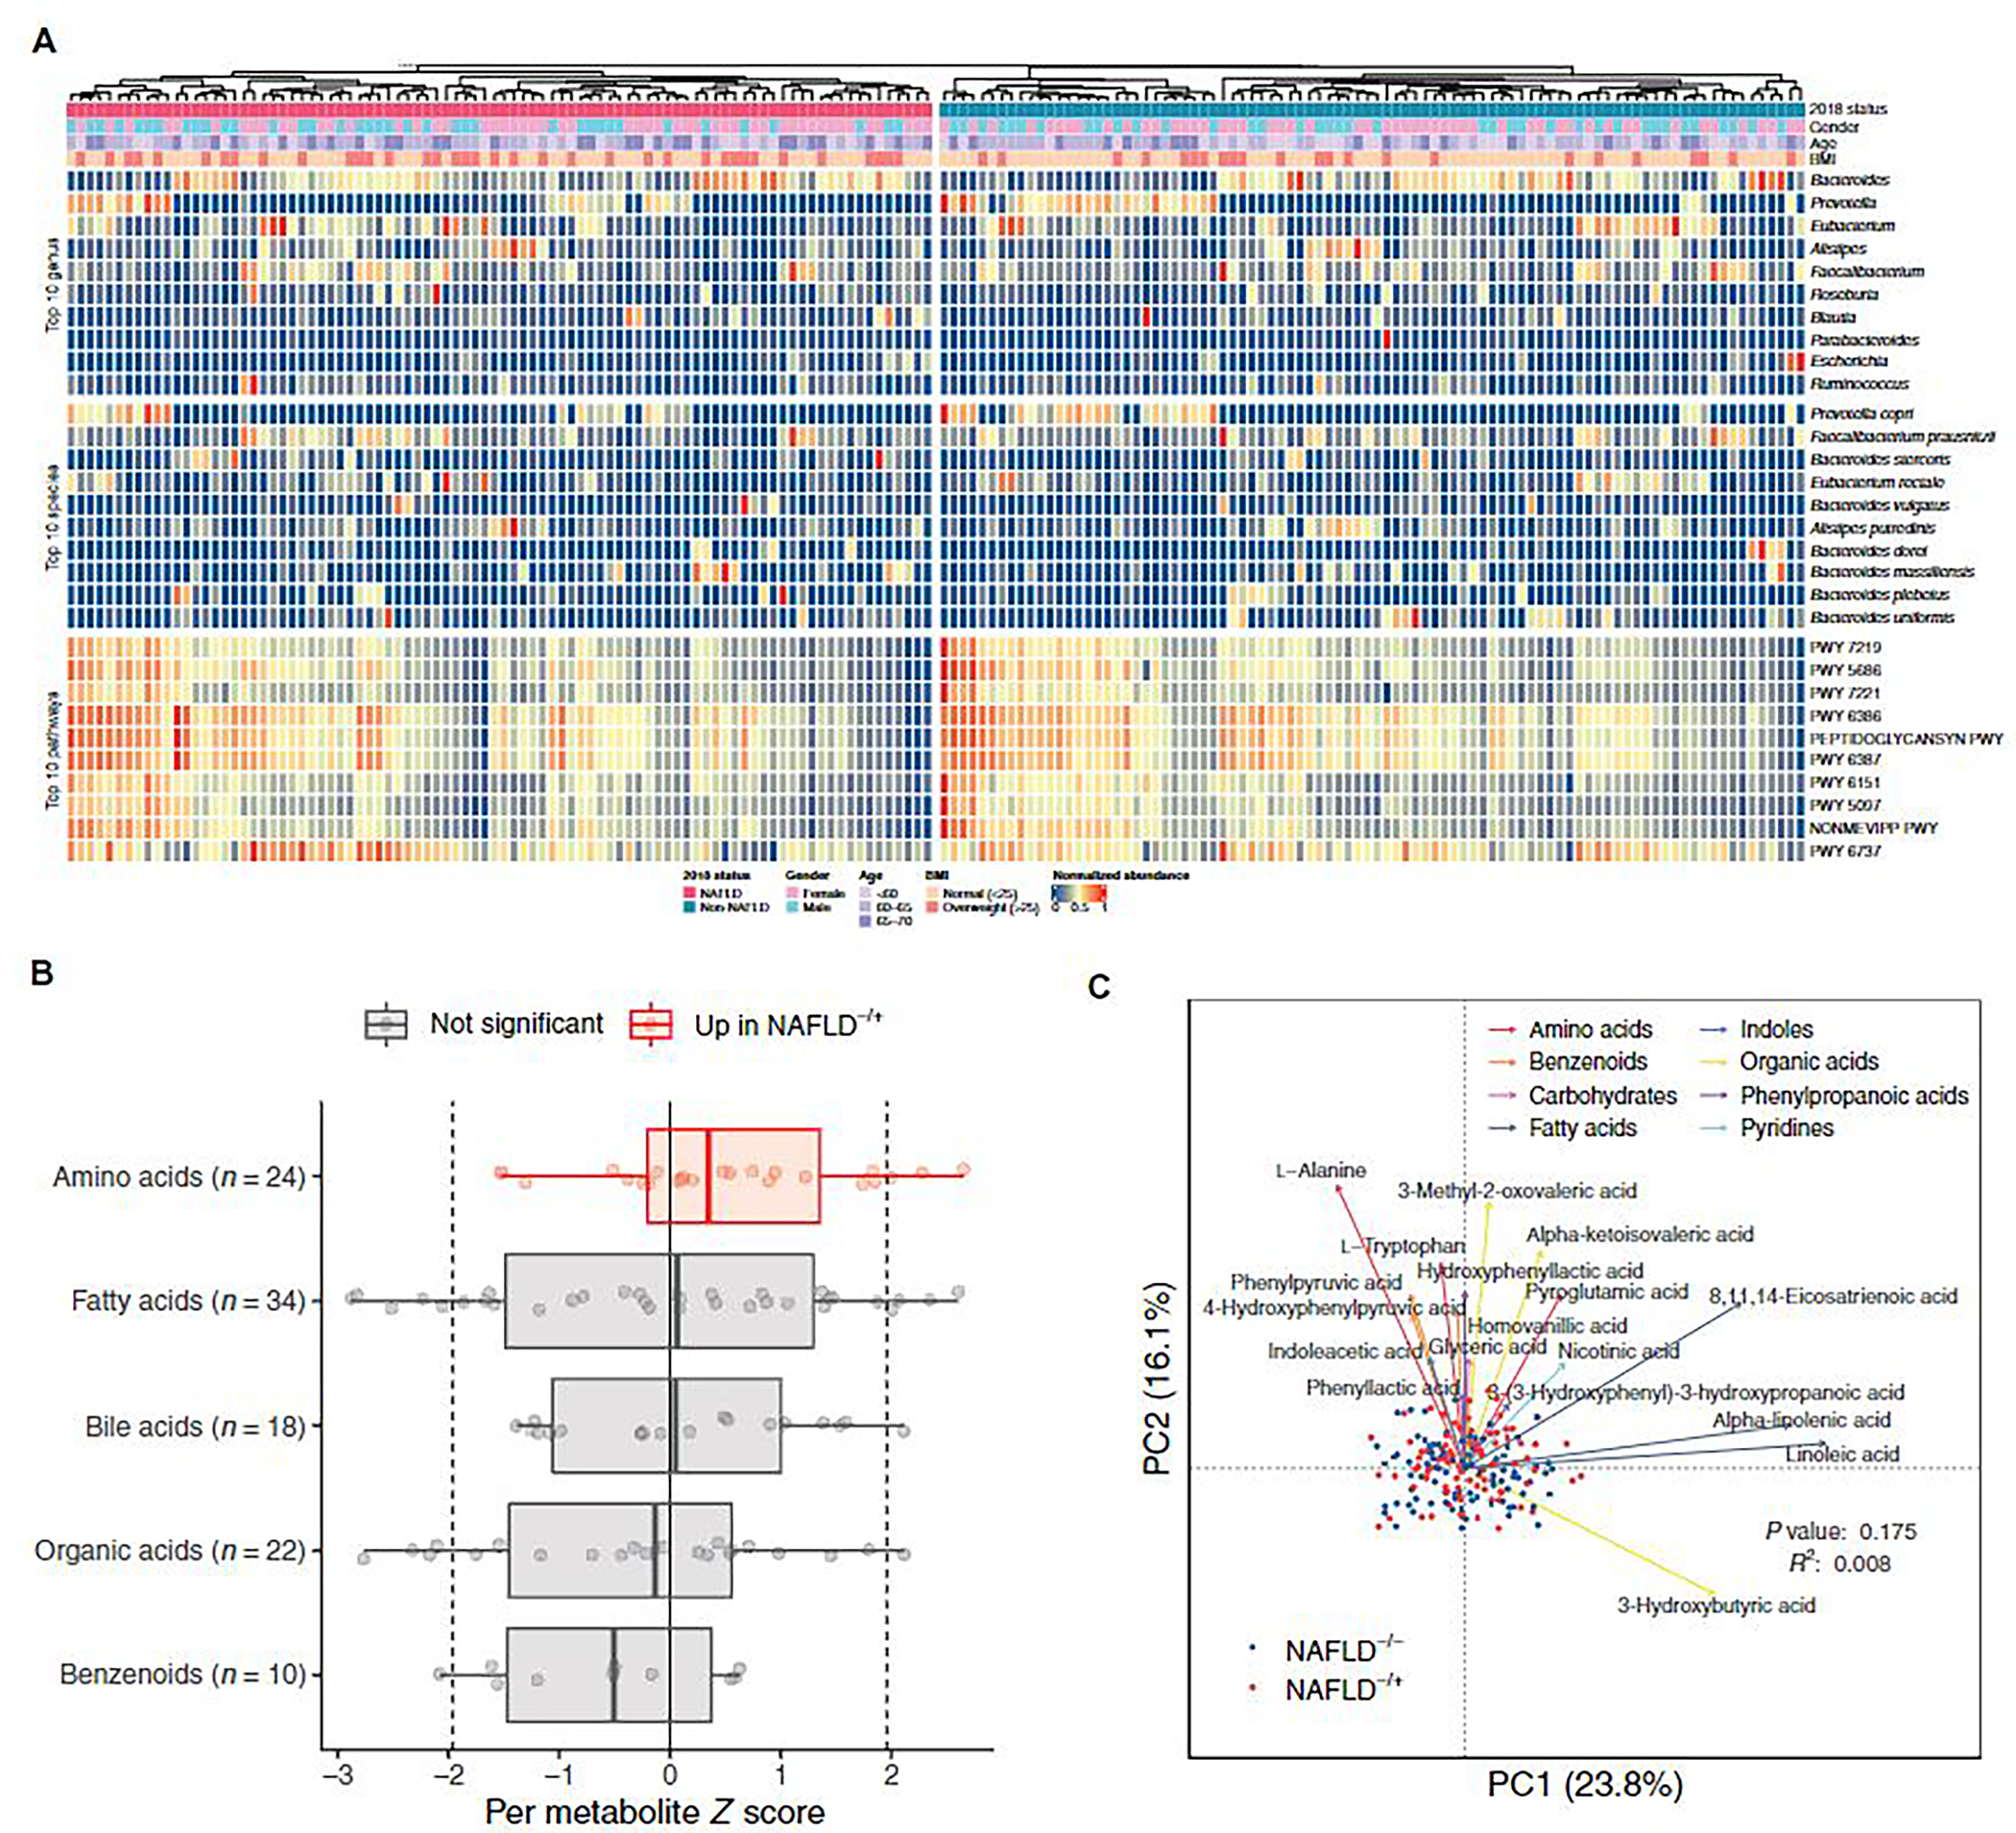
Fig. 2. Global characteristics of gut microbiome and serum metabolome.

(A) Relative abundance of the 10 most abundant genera, species, and pathways for the 180 participants at baseline, grouped by NAFLD status at the follow-up visit. Anthropometric characteristics of the participants at baseline are also shown. Abundance values are normalized to the range of 0 and 1. (B) Changes of metabolites (μM) in metabolite classes containing at least 10 metabolites. Each point represents a metabolite and its z score from Wilcoxon rank-sum test comparing the two groups (negative indicates higher abundance in NAFLD−/−; positive indicates higher abundance in NAFLD−/+). Dotted lines at −1.96 and 1.96 denote the significance threshold. Colors indicate comparisons between z scores of metabolites in a metabolite class against the z scores of metabolites in all other classes. Box plots show median, lower/upper quartiles, and whiskers (the last data points 1.5 times interquartile range from the lower or upper quartiles). (C) Principal coordinates analysis for 180 participants based on Bray-Curtis distances using baseline serum concentrations of 123 metabolites. For each metabolite class, the top 3 (or fewer) metabolites that were significantly associated with the metabolome variation in the study cohort are shown. PC, principal coordinates.
