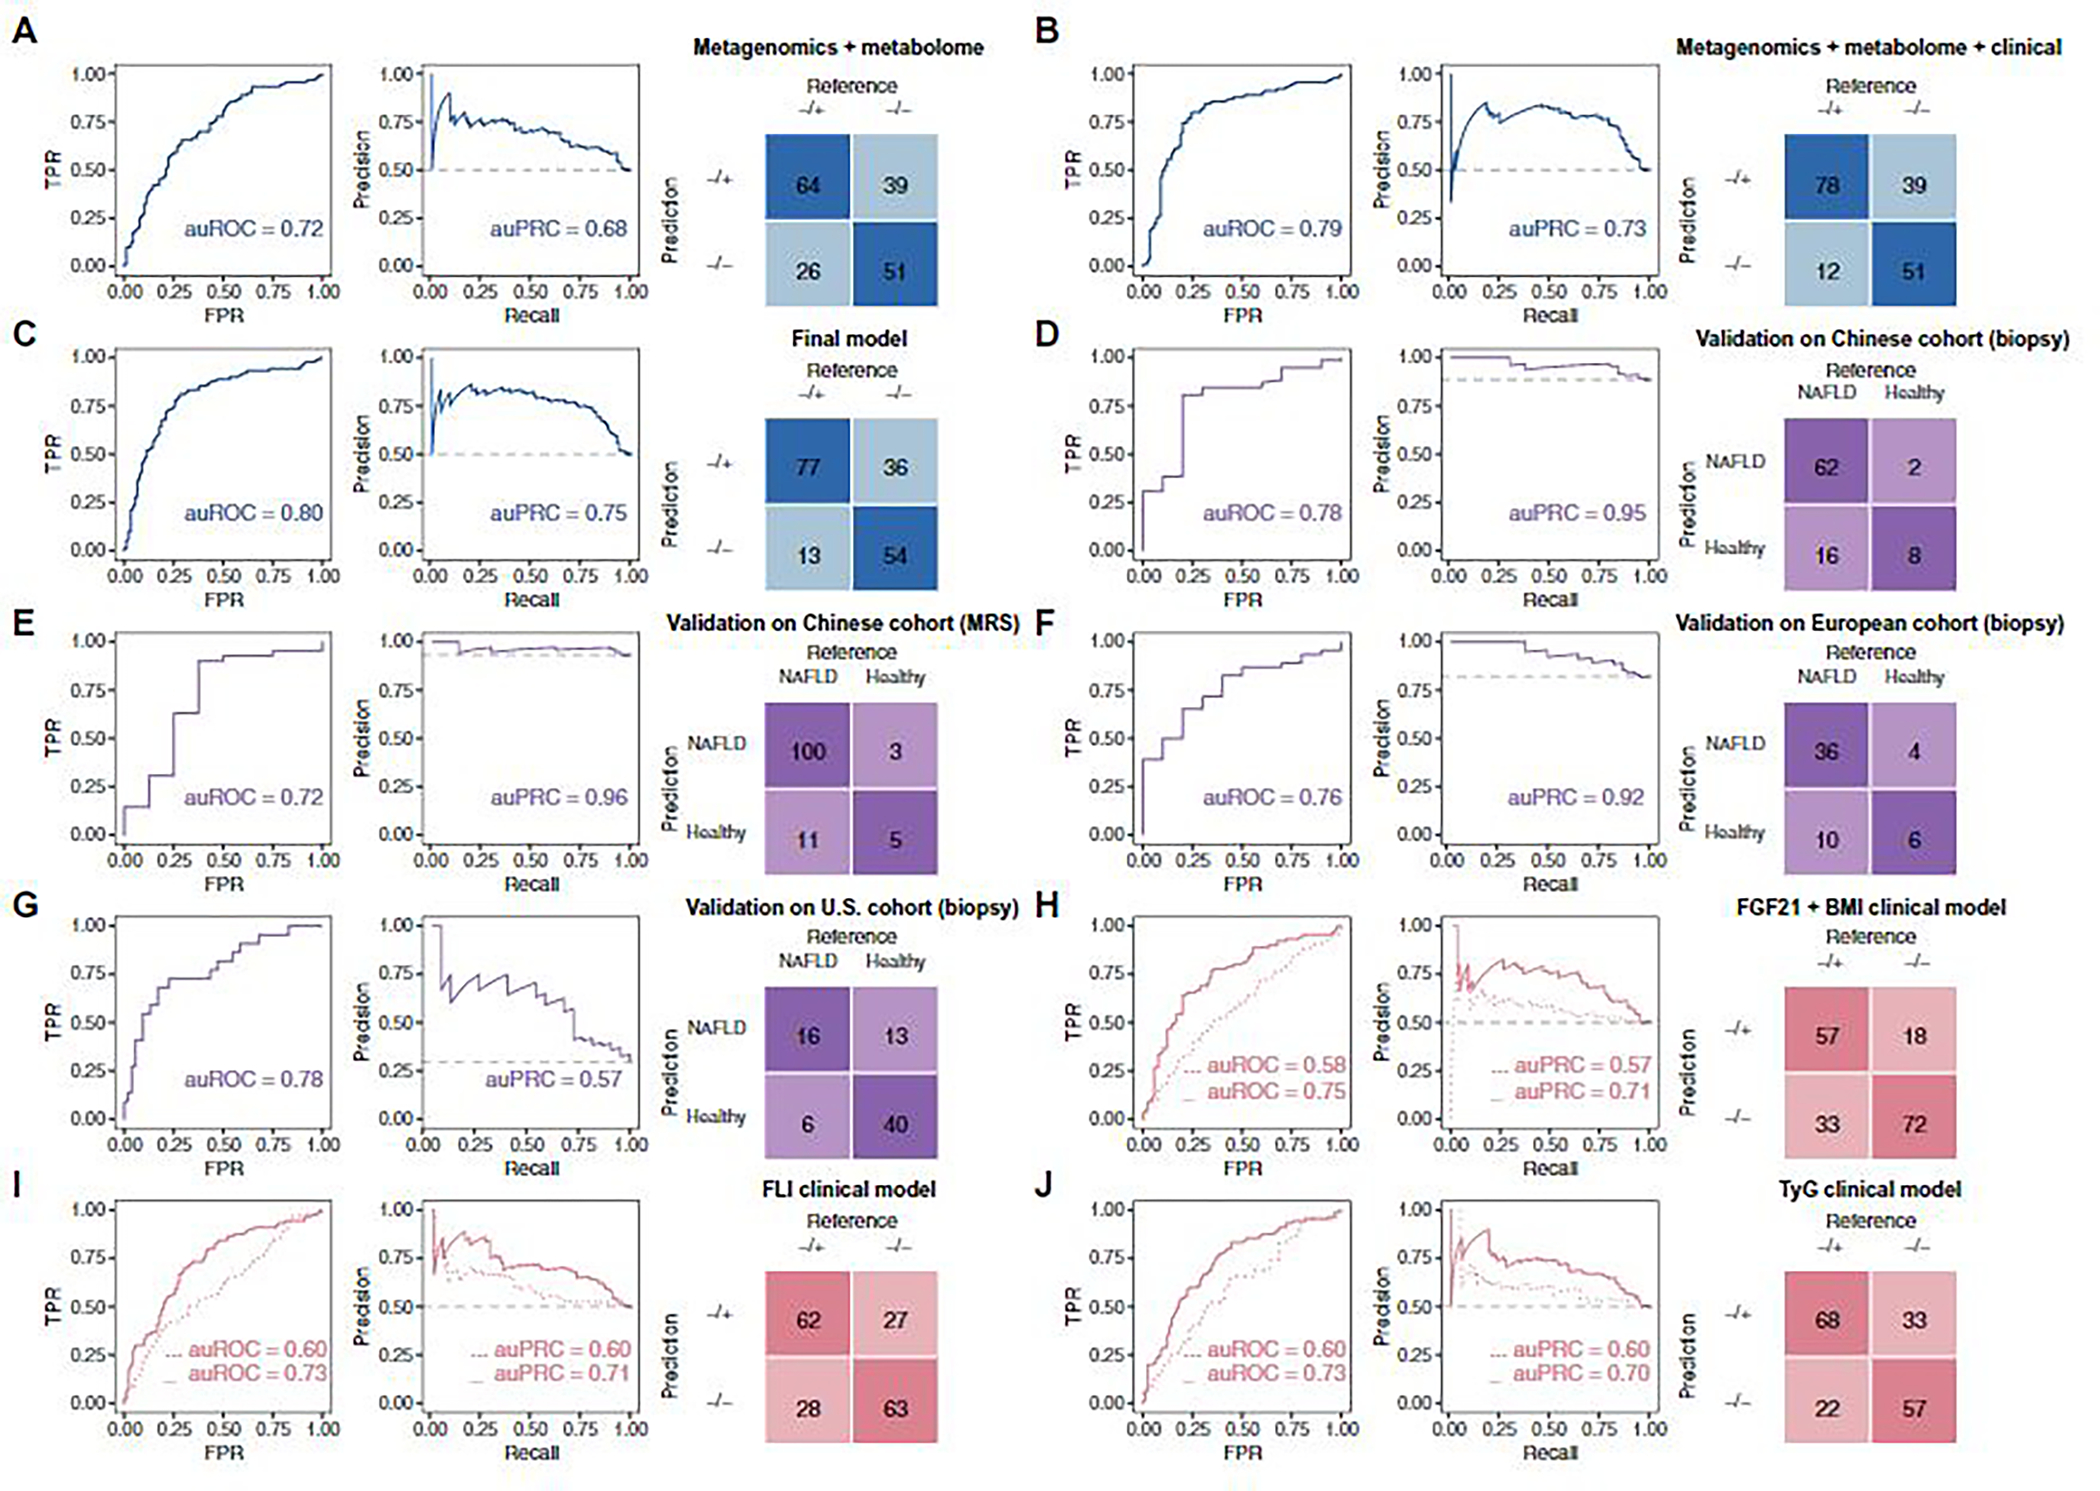
Fig. 3. Predictive performance of machine learning models in the study cohort and diagnostic performance of the final model in external cohorts.

(A to C, in blue) Performance of leave-one-out iterative machine learning models discriminating between NAFLD−/+ and NAFLD−/− groups using features of the following: (A) metagenomics + metabolome, (B) metagenomics + metabolome + 2 clinical parameters (HDL and fasting insulin), and (C) metagenomics + metabolome + 2 clinical parameters (HDL and fasting insulin) + anthropometrics (BMI and age). (D to G, in purple) Diagnostic performances of a model built based on subsets of the selected features to discriminate between participants who were healthy or had NAFLD in four external cohorts: (D) a Chinese cohort in which NAFLD diagnosis was determined with biopsy, (E) a Chinese cohort in which NAFLD diagnosis was based on MRS, (F) a biopsy-diagnosed European NAFLD cohort, and (G) a biopsy-diagnosed U.S. cirrhosis cohort. (H to J, in peach) Leave-one-out iterative machine learning performance to discriminate between NAFLD−/+ and NAFLD−/− groups in models of: (H) FGF21 + BMI clinical model, with and without metagenomics + metabolome features; (I) FLI clinical model, with and without metagenomics + metabolome features; and (J) TyG clinical model, with and without metagenomics + metabolome features. (H to J) Models without metagenomics and metabolome features were trained by logistic regression (dotted lines); models including metagenomics and metabolome features were trained by random forest (solid lines). Confusion matrices in (F) to (H) are from models with metagenomics and metabolome features. The figure colors represent the purpose of the model: blue, model construction; purple, external validation in cohorts of different ethnicity; peach, testing performance of previous clinical models in our cohort. Further details of the overall machine learning analysis framework can be found in fig. S6. auROC, area under the receiver operating characteristics curve; auPRC, area under the precision-recall curve; TPR, true-positive rate; FPR, false-positive rate.
