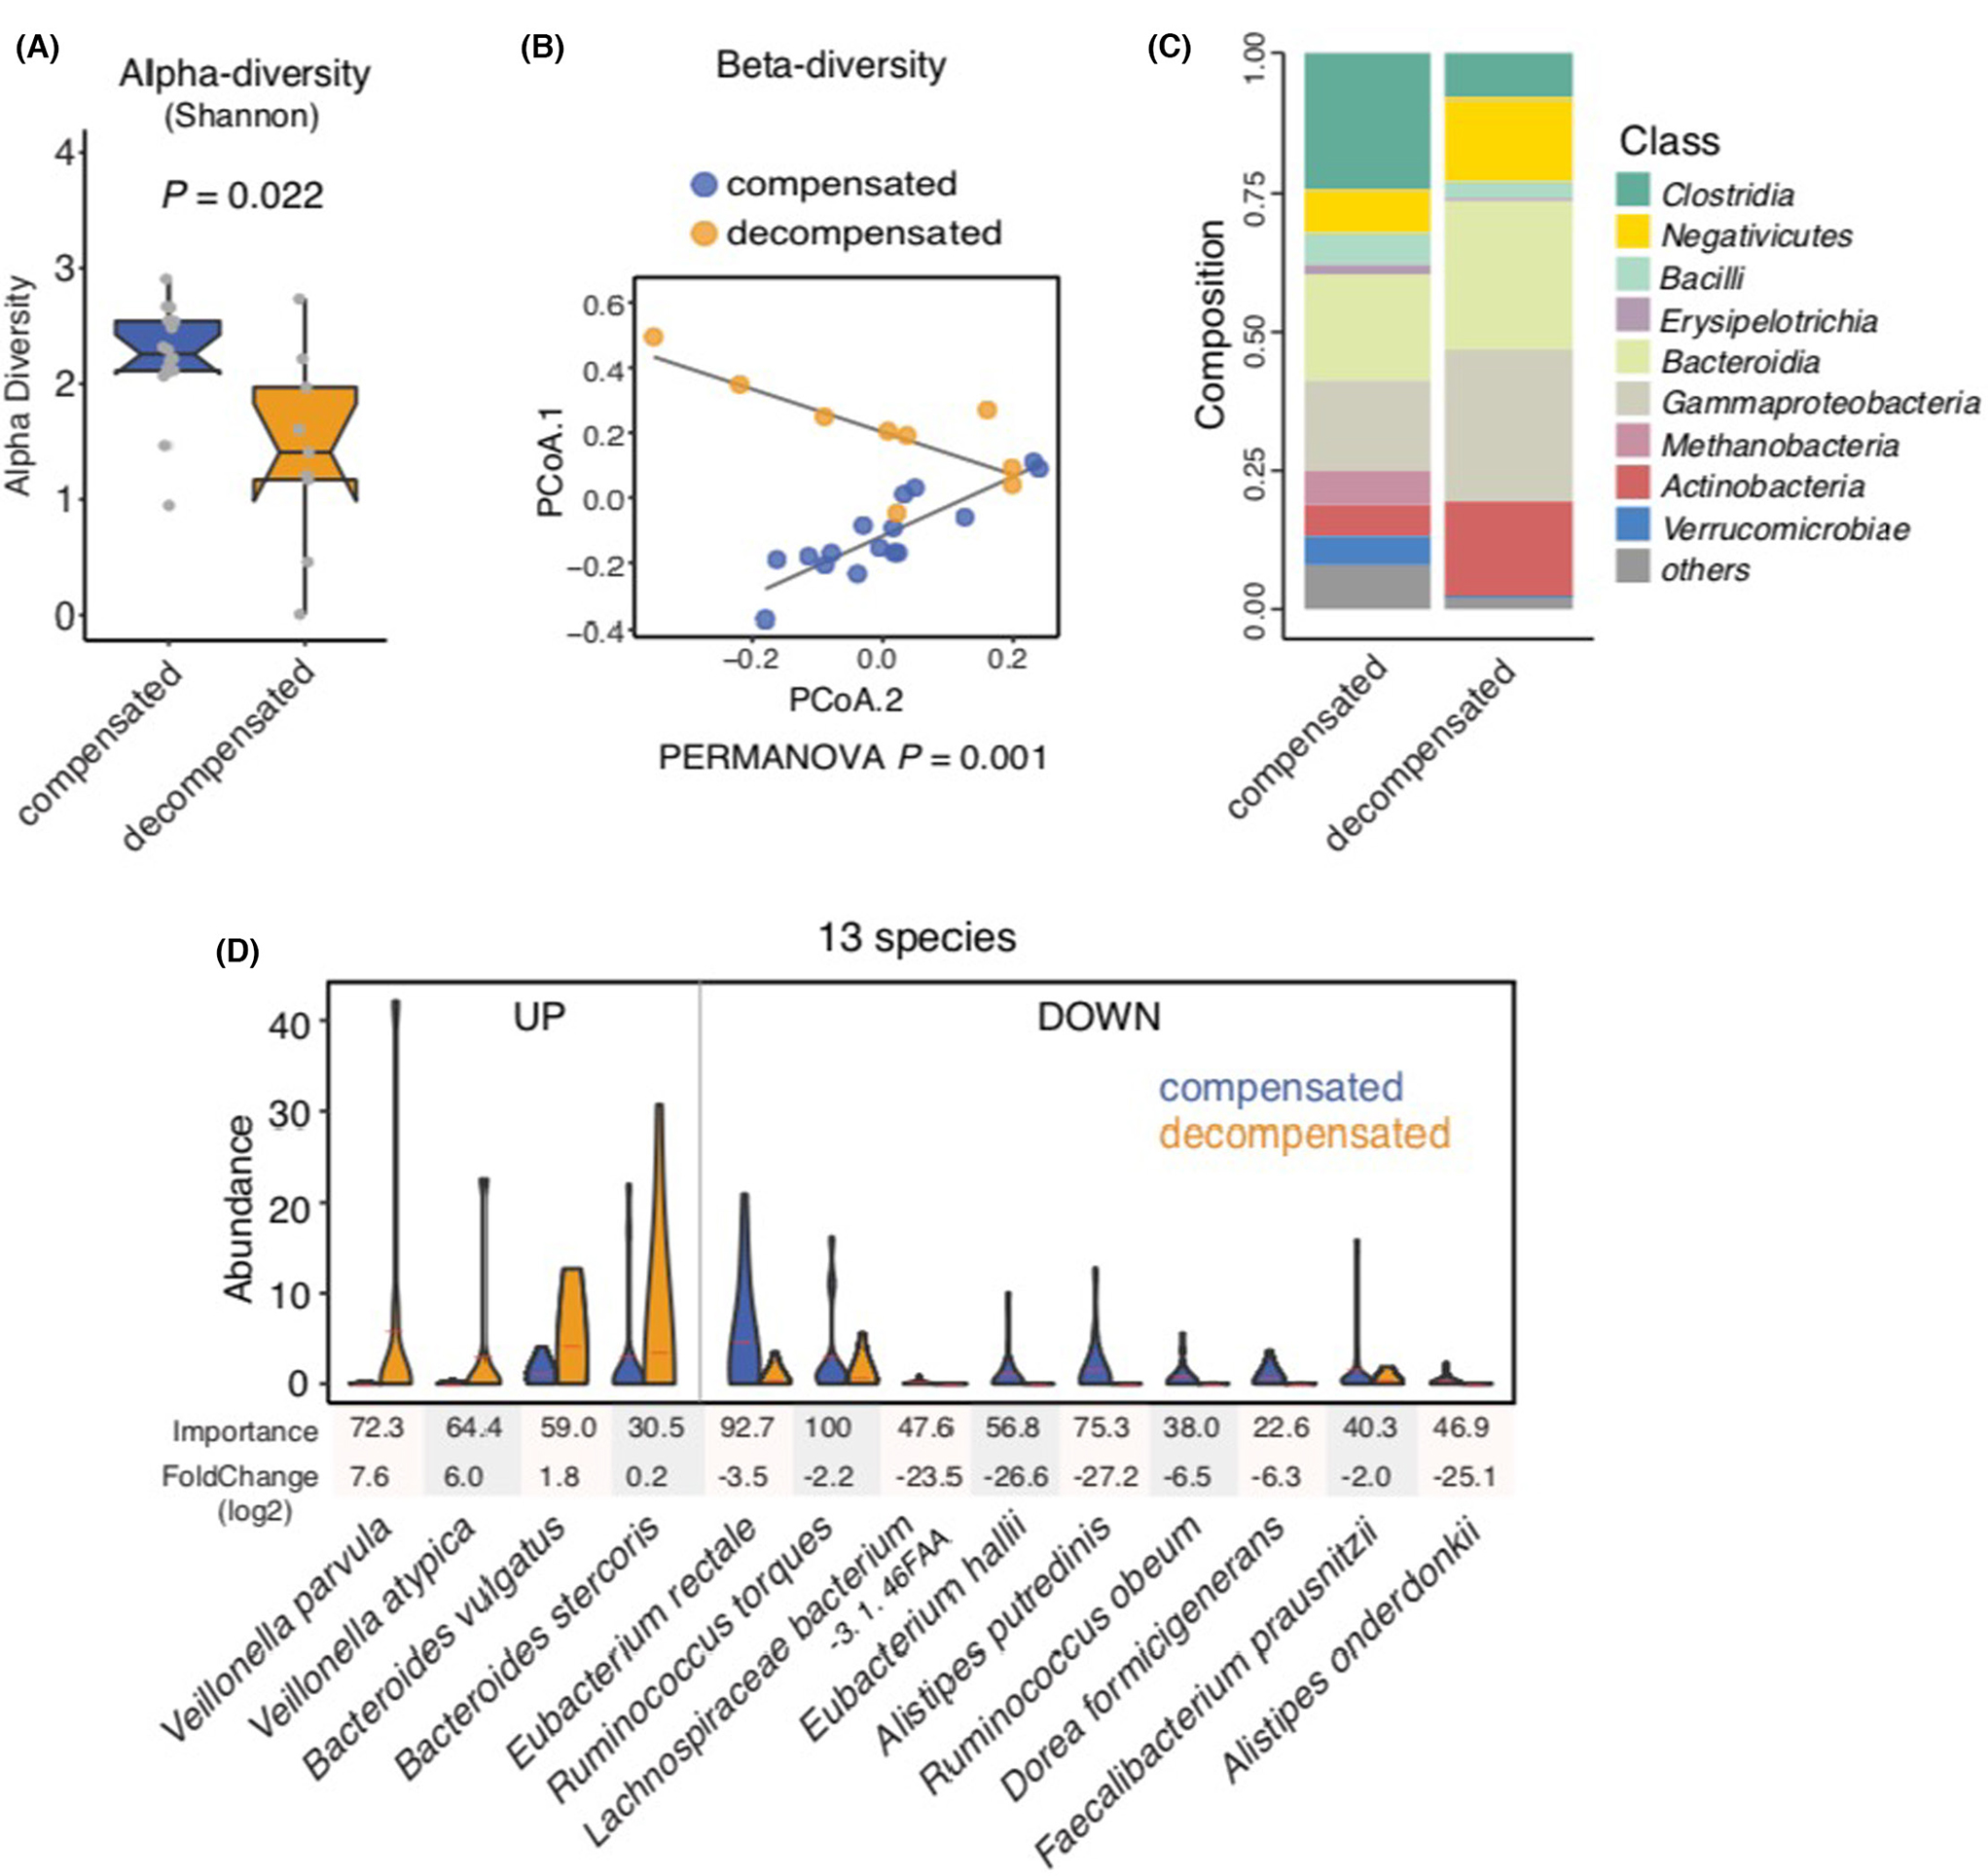
FIGURE 1.

Metagenomic profiling in non-alcoholic fatty liver disease (NAFLD)-related cirrhosis, comparing compensated and decompensated cirrhosis. (A) Shannon α-diversity scores highlighted significant decreases in the richness of gut microbiota in the decompensated NAFLD cirrhosis group (n = 9) compared with the compensated NAFLD cirrhosis group (n = 16; p = 0.022). Grey dots represent values for individual participants. Boxes represent the interquartile range (IQR) between the first and third quartiles. Median values are represented by horizontal lines within the boxes. Notches represent 95% confidence intervals for the medians. Whiskers indicate the range from minimum (first quartile −1.5 × IQR) to maximum (third quartiles +1.5 × IQR). (B) Principal coordinate analysis of stool samples from decompensated and compensated NAFLD cirrhosis patients using weighted-UniFrac distances (PERMANOVA = 0.001). (C) Stacked bar plots depicting class-level differences in gut microbiome composition between decompensated NAFLD cirrhosis and compensated NAFLD cirrhosis. The ‘others’ subcategory includes rare species (<1%). (D) A metagenomic signature of 13 discriminatory species in decompensated NAFLD cirrhosis compared to compensated NAFLD cirrhosis. Species were chosen from the highest scores of Mean Decrease in Gini using Random Forest (RF) feature selection. Importance and log2FoldChange were presented by each species.
