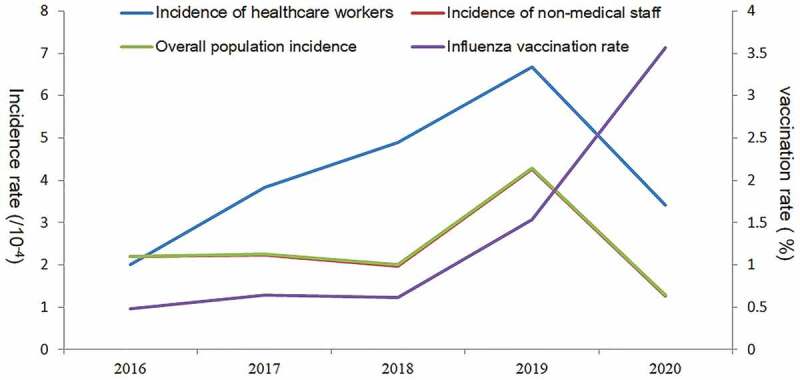
Figure 1.

Influenza incidence and influenza vaccination rate in Ningxia from 2016 to 2020.
Incidence of health-care workers: the proportion of health-care workers with influenza of Ningxia. Incidence of non-medical staff: the proportion of non-medical staff with influenza of Ningxia. Overall population incidence: the proportion of influenza in the whole population of Ningxia. Influenza vaccination rate: the proportion of the whole population vaccinated against influenza of Ningxia.
