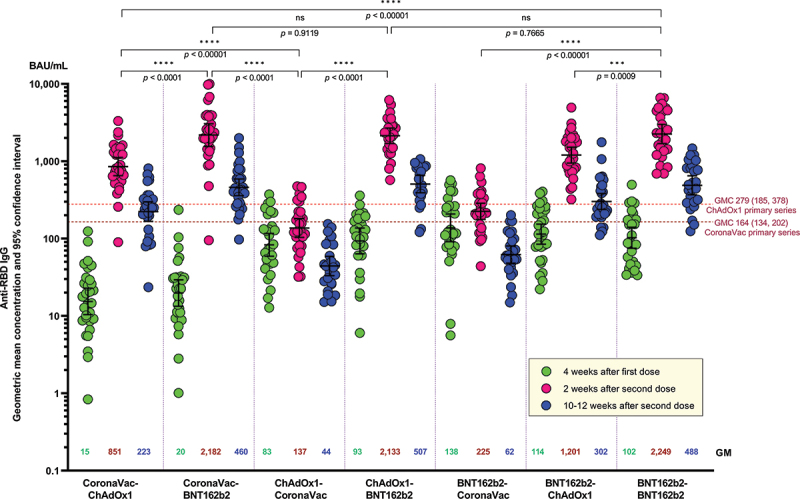
Figure 2.

Anti-SARS-CoV-2 receptor binding domain (RBD) IgG at 4 weeks after the first dose, and 2 and 10–12 weeks after the second dose. Numbers in the graph represent geometric mean concentration (GMC) and the error bars represent 95% confidence interval. Dotted lines represent the GMC (95% CI) of anti-SARS-CoV-2 RBD IgG at 2 weeks after the second dose of homologous primary series of CoronaVac and ChAdox1 reported by our study group using the same laboratory method and facility as this study.4 Unpaired t-test was used to compare IgG GMC between groups at two weeks after second dose vaccination.
