Figure 2.

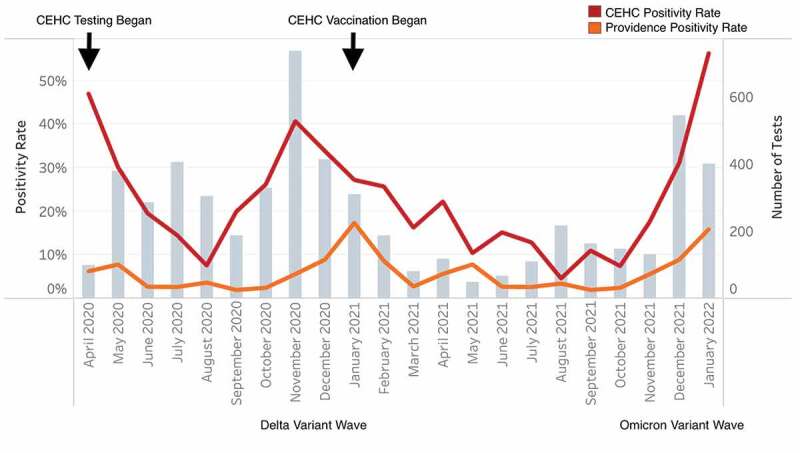
CEHC patients had higher test positivity rates than the city of Providence. Monthly testing rate and positivity are shown for Providence and the clinic.
Note: Number of tests completed (bars) and rate of positive tests (dots) by month.

CEHC patients had higher test positivity rates than the city of Providence. Monthly testing rate and positivity are shown for Providence and the clinic.
Note: Number of tests completed (bars) and rate of positive tests (dots) by month.