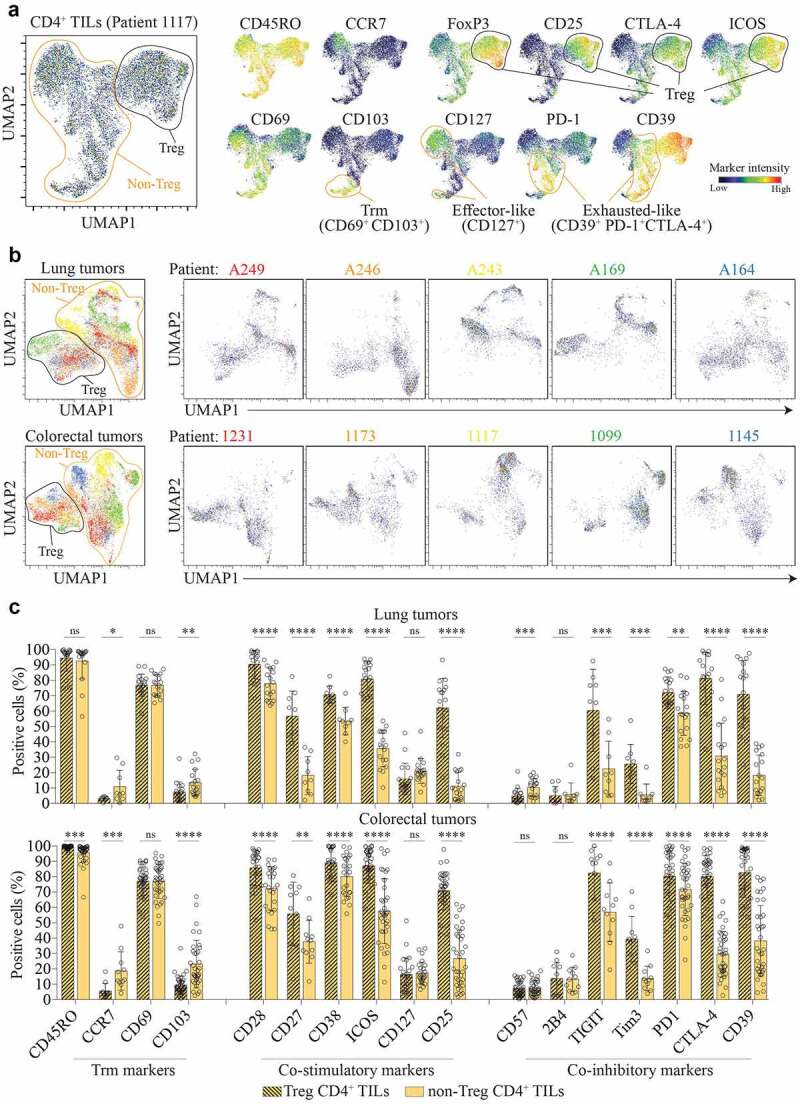
Figure 2.

CD4+ TILs are heterogeneous within the tumor and across patients.
(a) UMAP plot on CD4+ TILs from the tumor of a colorectal cancer patient (1117) (left panel). Normalized expression intensities of CD45RO, CCR7, CD69, CD103, CD25, FoxP3, CTLA-4, CD127, ICOS, PD-1, and CD39 were calculated and overlaid on the UMAP plot (right panel). (b) UMAP plot on CD4+ TILs isolated from lung tumors (top panel) or colorectal tumors (bottom panel). Mass cytometry acquisition and UMAP analysis were performed simultaneously on five different patients. Patient identifiers refer to individual patients. n = 5 patients for each cancer type. (c) Expression of selected immune markers by Treg (black stripes) and non-Treg (yellow) CD4+ TILs. Data are from lung tumor samples of n = 28 (lung tumors) and n = 51 (colorectal tumors) biologically independent individuals. Means ± SD, Paired t test – two-tailed. *p ≤ 0.05, **p ≤ 0.01, ***p ≤ 0.001, ****p ≤ 0.0001
