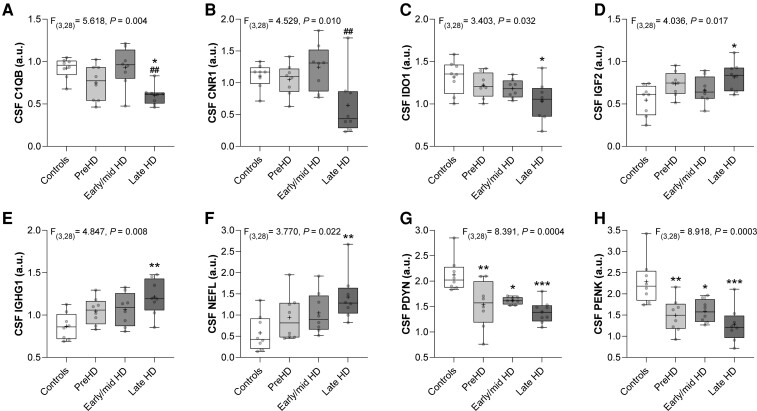
Figure 1.
Comparison of CSF protein levels across disease stages. Box and whisker plots comparing normalized CSF protein levels between controls (n = 8), preHD (n = 8), early/mid HD (TFC >5; n = 8), and late HD (TFC <5; n = 8) individuals. Intergroup differences were assessed using ANCOVA including age as a covariate and summary statistics are shown at the top of each plot. Post hoc tests were performed using Tukey’s test to correct for multiple comparisons. (A) C1QB (*P = 0.010 compared with controls, ##P = 0.008 compared with early/mid HD), (B) CNR1 (##P = 0.008 compared with early/mid HD), (C) IDO1 (*P = 0.020 compared with controls), (D) IGF2 (*P = 0.012 compared with controls), (E) IGHG1 (**P = 0.004 compared with controls), (F) NEFL (**P = 0.002 compared with controls), (G) PDYN (*P = 0.012, **P = 0.004, ***P = 0.0003 compared with controls) and (H) PENK (*P = 0.012, **P = 0.004, ***P = 0.0002 compared with controls). Individual data points are plotted for each group. Boxes show 25th to 75th percentiles, the central band denotes the median, the plus sign denotes the mean, and the whiskers show the minimum and maximum values. ANCOVA = analysis of covariance; a.u. = arbitrary units; preHD = premanifest Huntington disease.

