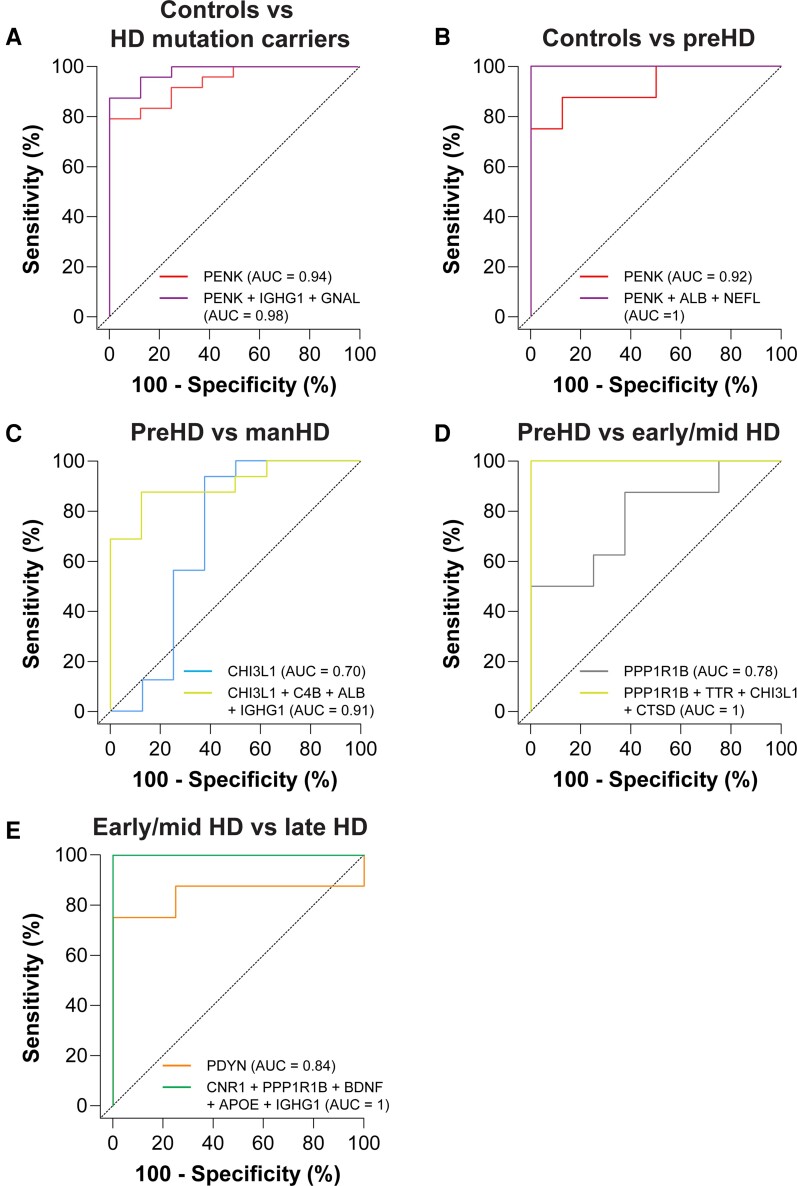
Figure 3.
Multi-marker CSF protein panels for stratifying subjects based on HD mutation status and disease severity. ROC curves showing individual and combinations of CSF proteins with the greatest discriminatory accuracy for distinguishing between (A) HD mutation carriers and controls, (B) preHD and controls, (C) manHD and preHD, (D) early/mid HD and preHD, (E) late HD and early/mid HD. Age-adjusted values were used for all analyses. AUC = area under the curve; manHD = manifest Huntington disease; preHD = premanifest Huntington disease; ROC = receiver operating characteristic.

