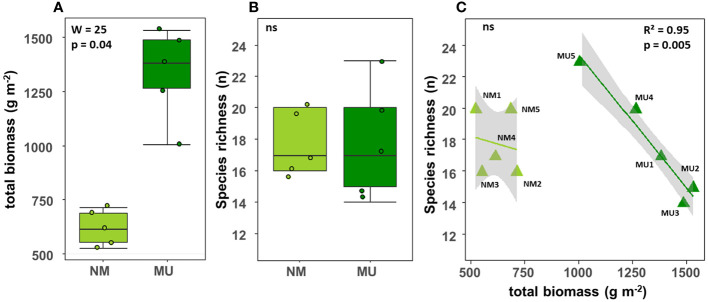
Figure 2.
Comparison of the total biomass (A) and species richness (B) between control (NM; no mulching) and mulching-treated (MU) areas, and relationship between species richness and total biomass (C) in the 10 sampling plots. The lines in figure C indicate the best fitting and its 95% confidence interval obtained through a generalized linear model (GLM). The boxplot indicates the median (line in the middle of the boxes), the interquartile range (boxes) and 1.5 times the interquartile range (whiskers). Results of the Wilcoxon test (A, B) or GLM model (C) are reported in each subfigure; the R2 value is the pseudo-R2 of the GLM model; ns, not significant (p > 0.05).

