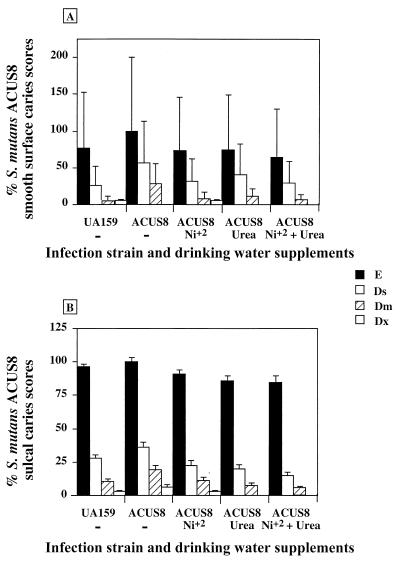
FIG. 7.
Mean caries scores from animals infected with the nonureolytic recombinant S. mutans ACUS8. All four jaw quadrants from each animal were scored for smooth-surface (A) and sulcal (B) caries. The graph represents the mean caries score and standard error of the mean from all animals in each group as a percentage of total (E) scores for ACUS8-infected animals fed a cariogenic diet, where 100% = 12 in panel A and 100% = 37 in panel B. All animals were fed a cariogenic diet with sweetened drinking water. Nickel chloride and urea were added to the drinking water as indicated underneath the bar chart. Statistical comparisons were made using the Tukey-Kramer HSD test (P ≥ 0.05). The symbols used are identical to those in Fig. 6.

