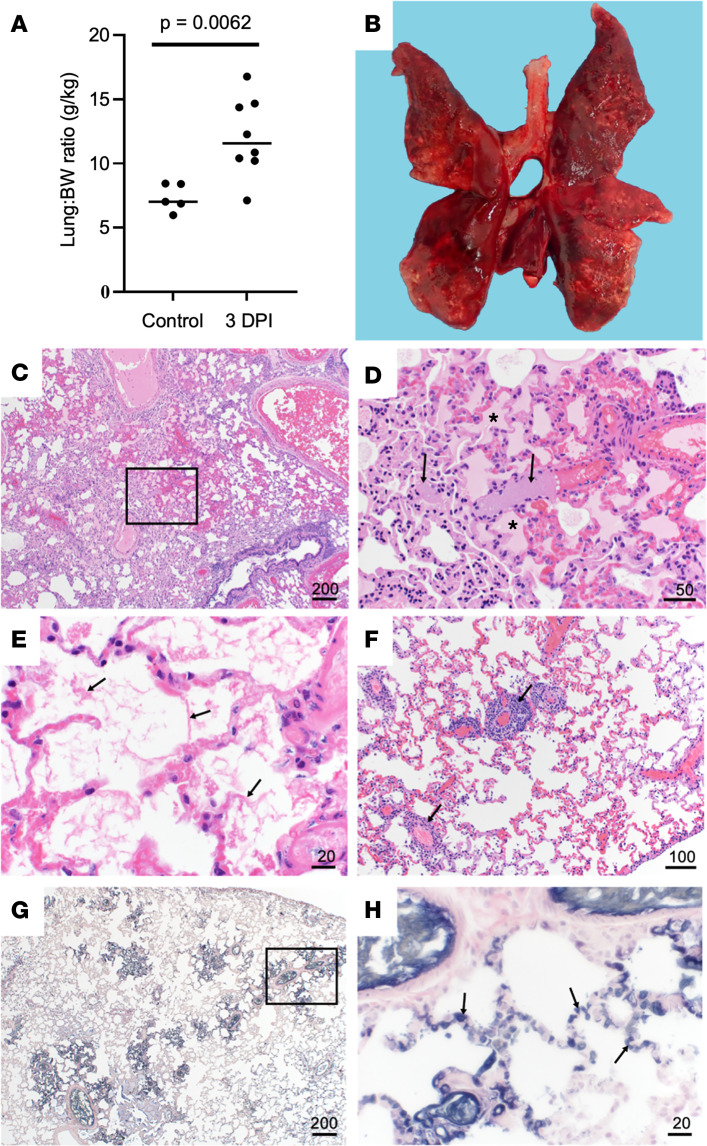
Figure 4. Pulmonary histopathology and IHC.
(A) Lung to BW ratio, Mann-Whitney test. Graph depicts median with individuals. (B) Diffusely consolidated dark-mottled red lungs. (C) Multifocal pulmonary congestion (box). (D) Enlarged section of image C, vascular thrombi (arrows) and alveolar edema (asterisks). (E) Alveolar fibrin (arrows). (F) Lymphoplasmacytic perivascular cuffing (arrows). (G) Pulmonary PTAH staining (black). (H) Enlarged section of G, microthrombi (arrows). Scale bar expressed in μm in lower right corner of each image.

