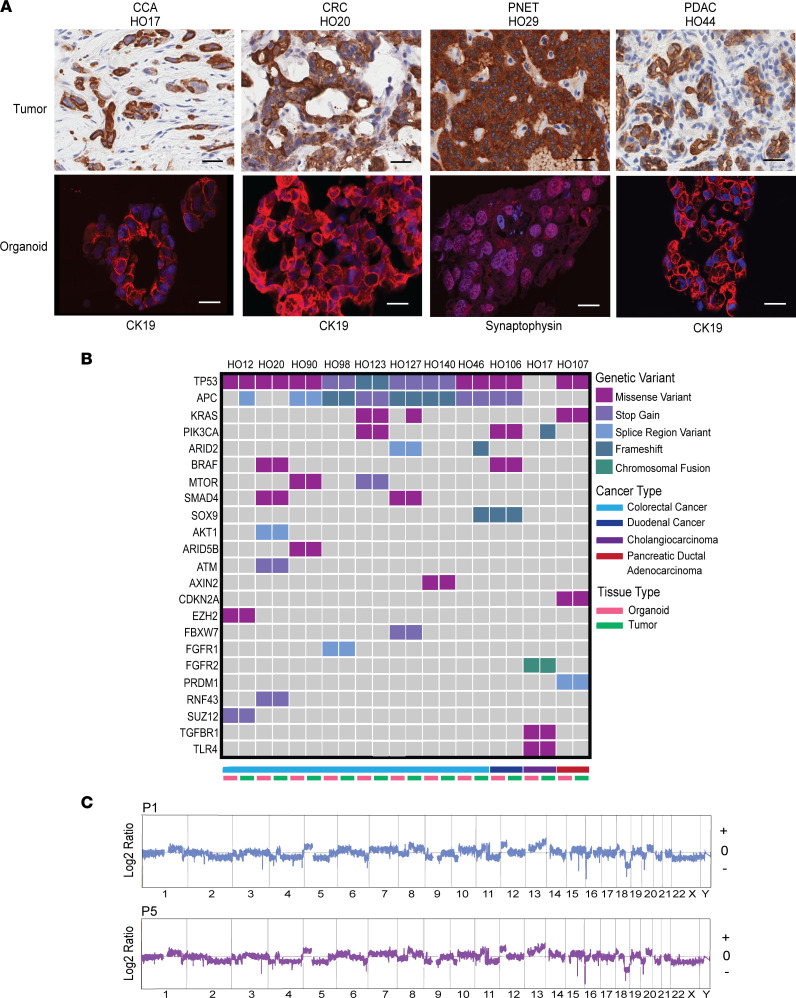
Figure 2. GI cancer PDOs are representative of the donor tumor.
(A) IHC of donor tumor (scale bars: 25 μm) and confocal IF images of corresponding organoid (scale bars: 20 μm) for common surface markers for GI cancers. In organoid panels, CK19 and synaptophysin are shown in red and DAPI in blue; n =4. (B) Genetic comparison of clinically relevant variants between the PDO and the corresponding donor tumor; n = 11. (C) Copy number variant (CNV) profile of CRC PDO HO12 at passage 1 and passage 5 using CGH. The x and y axes in the CGH plots represent chromosome and position, and log2 ratios for each chromosome, respectively.

