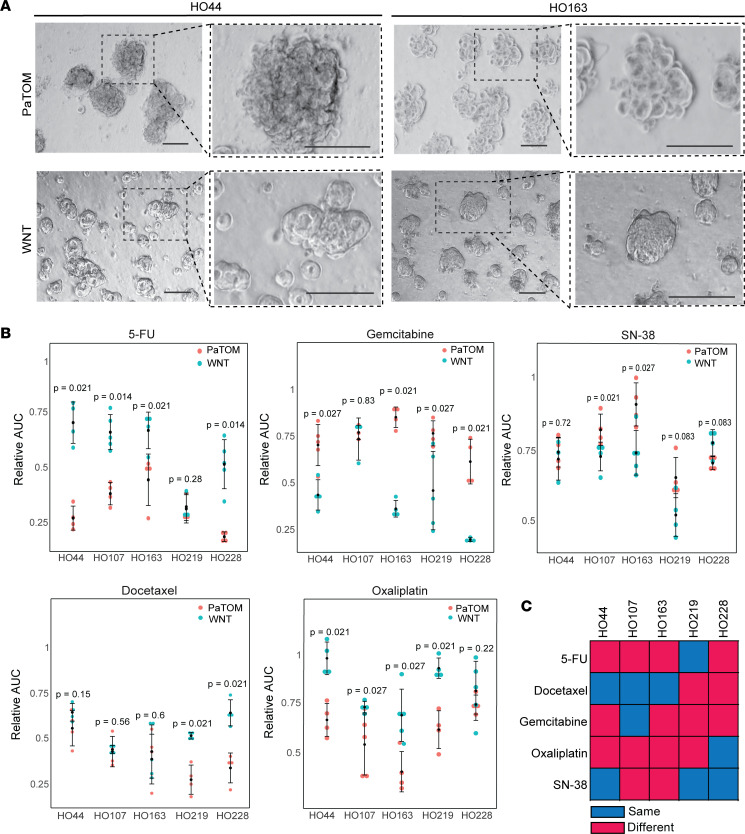
Figure 3. PDOs grown in 2 different culture media exhibit differential response to chemotherapy.
(A) Brightfield images of PDAC PDOs HO44 and HO163 grown in WNT and PaTOM media at 2 magnifications (scale bars: 100 μm). (B) Relative AUC values for 5 PDAC PDOs in response to 5-FU, gemcitabine, SN-38, docetaxel, and oxaliplatin grown in PaTOM and WNT media. Each dot represents the relative AUC for 1 replicate for each PDAC PDO derived from the line graphs in Supplemental Figure 8. P values indicate level of significance using Wilcoxon’s rank sum test between AUCs of PDOs grown in PaTOM versus WNT media; n = 5. (C) Summary of 5 PDAC PDO responses in PaTOM and WNT to 5 chemotherapies. Red indicates response was significantly different (P ≤ 0.05) between PaTOM and WNT for the same PDO. Blue indicates the response was not significantly different (P > 0.05) between media.

