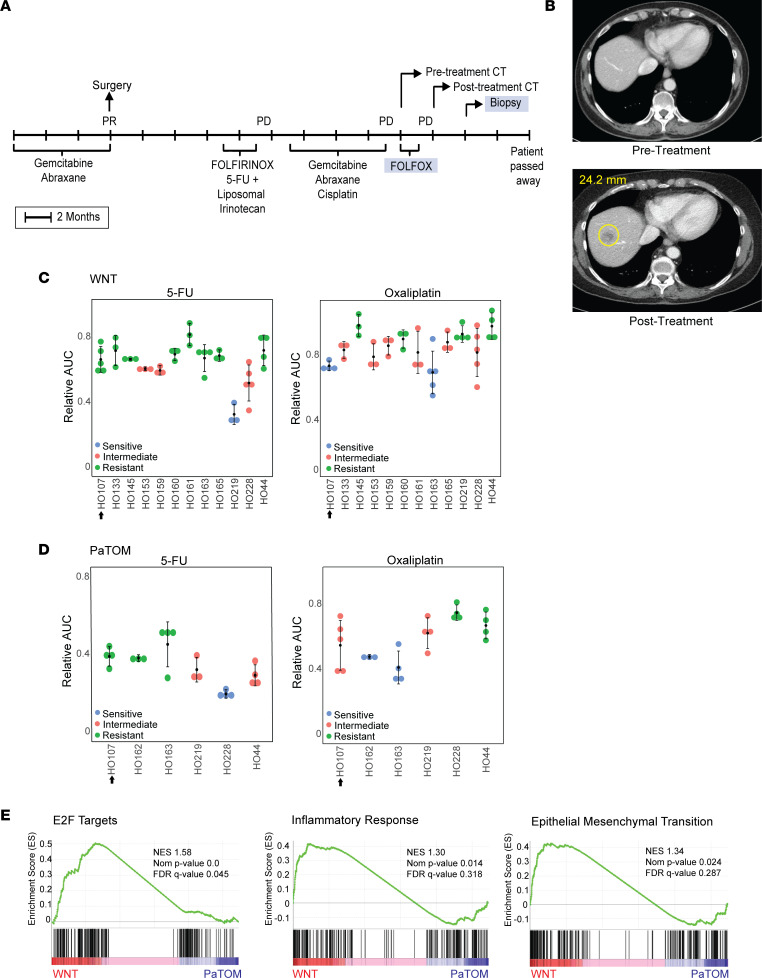
Figure 5. The effect of PDO culture media on clinical correlation: a case study.
(A) Donor patient treatment history for PDO HO107. After surgery, this patient received a single dose of FOLFIRINOX (folinic acid + 5-FU + irinotecan + oxaliplatin) followed by 5-FU and liposomal irinotecan. (B) CT scans of donor patient for PDO HO107 before and after treatment with progressive disease (PD), where a metastatic liver lesion of 24.2 mm developed following treatment with FOLFOX. (C) Relative AUC values for PDO HO107 in response to 5-FU and oxaliplatin in WNT media. Each dot represents the relative AUC for 1 replicate derived from the line graphs in Supplemental Figure 14A; n = 12. (D) Relative AUC values for PDO HO107 in response to 5-FU and oxaliplatin in PaTOM media. Each dot represents the relative AUC for 1 replicate derived from the line graphs in Supplemental Figure 14B; n = 6. The data in this figure for HO17, HO44, HO163, HO219, and HO228 were derived from Supplemental Figure 8. PDO response was determined as intermediate, sensitive, or resistant using Jenks Natural Breaks. The arrow next to the PDO number indicates the PDO response corresponding to the patient tumor response in the CT scan. (E) GSEA using Hallmark gene sets showing enriched gene sets in PDAC PDO HO107 in WNT media. NES, normalized enrichment score.

