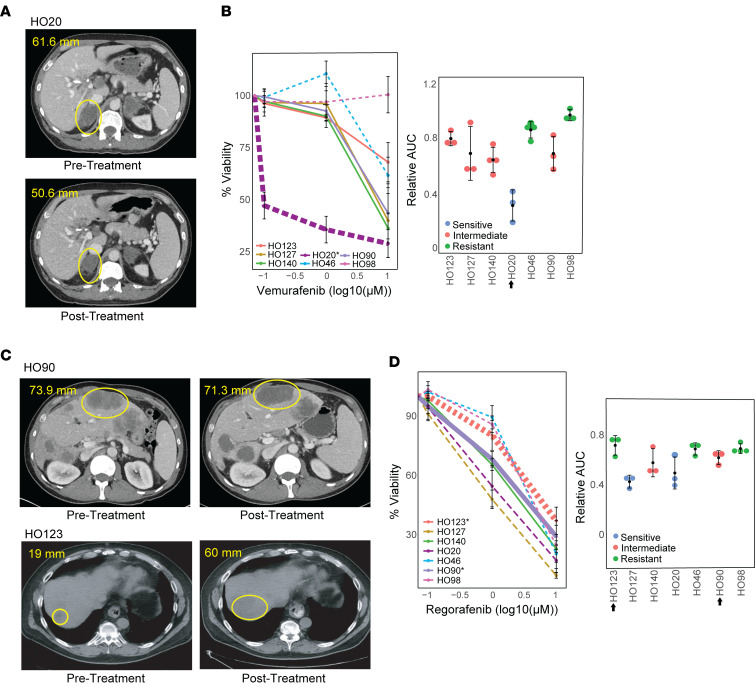
Figure 6. PDO therapeutic agent sensitivity correlates with patient tumor response.
(A) CT scans of donor patient for PDO HO20 before and after treatment with partial response (PR), where the lesion decreased from 61.6 mm to 50.8 mm after 2 cycles of treatment with vemurafenib. (B) Percentage cell viability and relative AUC values in response to vemurafenib for 7 CRC PDOs, showing that PDO HO20 is sensitive to vemurafenib; n = 7. (C) CT scans of donor patients before and after treatment showing stable disease (SD) in 1 lesion (HO90) and progressive disease (PD) in 1 lesion (HO123) following treatment with regorafenib. (D) Percentage cell viability and relative AUC values in response to regorafenib for 7 CRC PDOs, showing that PDO HO90 is intermediate and HO123 is resistant to regorafenib; n = 7. For line graphs, dashed lines indicate sensitive, solid lines indicate intermediate, dotted lines indicate resistant, categorized using the Jenks Natural Breaks algorithm. The HO number with an asterisk and the thickest line in the line graphs indicate PDO response corresponding to the patient tumor response shown in the CT scan. The arrow next to the HO number in the relative AUC graph indicates the PDO corresponding to the donor tumor.

