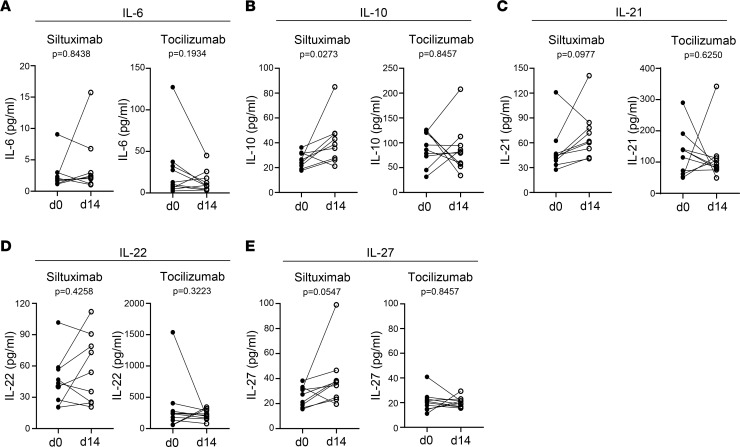
Figure 5. Siltuximab but not tocilizumab enhances T cell production of regulatory cytokines.
Meso Scale Discovery assays were used to measure cytokine production by enriched pan T cells from siltuximab-treated or tocilizumab-treated patients with T1D stimulated with anti-CD3/anti-CD28–coated beads for 4 hours. Each line represents an individual patient; n = 9 for siltuximab (except for A where n = 8) and n = 10 for tocilizumab. Solid circles represent d0 prior to administration, and open circles represent d14 after drug administration (d14). (A) IL-6, (B) IL-10, (C) IL-21, (D) IL-22, and (E) IL-27. Statistical test: Wilcoxon matched-pairs signed-rank test.

