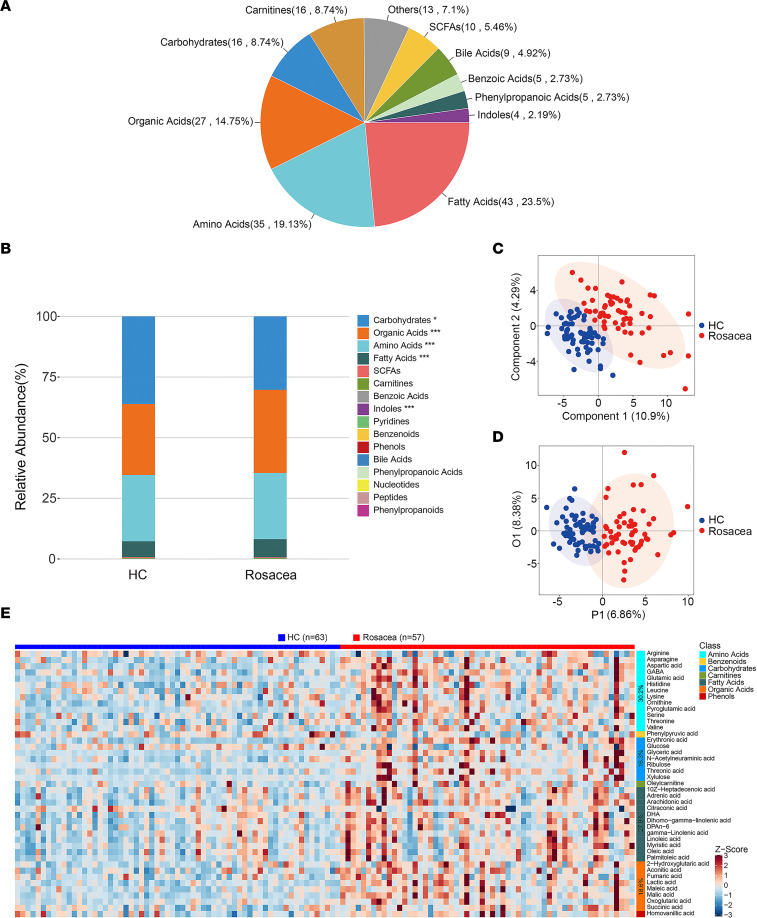
Figure 1. Serum metabolic profiling in patients with rosacea identified by targeted metabolomics.
(A) The summary of detected metabolite counts in each metabolite class. (B) The relative abundance of each metabolite classes in different groups is shown in the stacked bar chart. (C) PLS-DA score plots from the healthy (n = 63) and rosacea groups (n = 57). (D) OPLS-DA score plots from the healthy (n = 63) and rosacea groups (n = 57). (E) Visualization of 43 serum differential metabolite expression values in 2 groups by heatmap. *P < 0.05, ***P < 0.001 by 2-tailed unpaired Student’s t test. HC, healthy control (blue); Rosacea, rosacea patients (red); SCFAs, short chain fatty acids.

