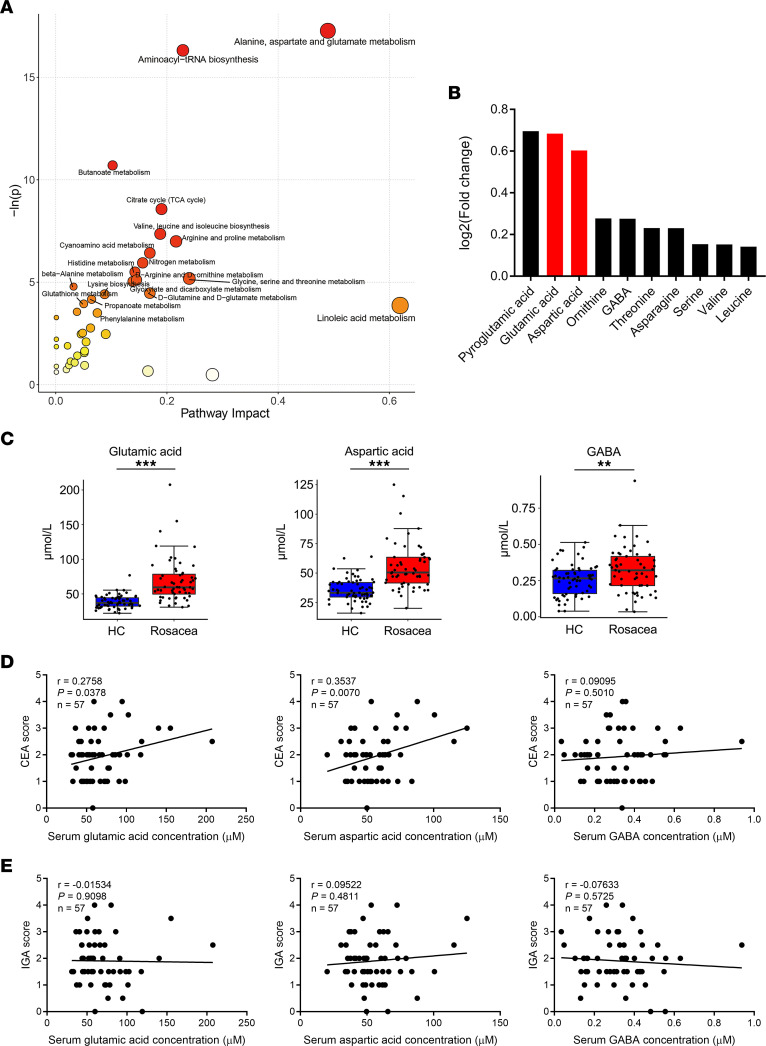
Figure 2. Glutamic acid and aspartic acid are increased in serum of patients with rosacea.
(A) Pathway analysis bubble plot by hsa set using identified differential metabolites. (B) Expression changes of the top 10 differential metabolites in amino acids. (C) Box plot of top 3 differential metabolites of alanine, aspartate, and glutamate metabolism pathway. HC, healthy control (blue) (n = 63); rosacea, rosacea patients (red) (n = 57). Box plots show the interquartile range (box), median (line), and minimum and maximum (whiskers). (D) Correlation of serum amino acid levels in patients with rosacea with Clinician’s Erythema Assessment (CEA) scores. (E) Correlation of serum amino acid levels in rosacea patients with Investigator’s Global Assessment (IGA) scores. Data represent the mean ± SEM. *P < 0.05, **P < 0.01, ***P < 0.001. Two-tailed unpaired Student’s t test or Mann-Whitney U test was performed to compare the differences in metabolite levels between the 2 groups (C). Spearman’s correlation test was used for the correlation analysis (D and E).

