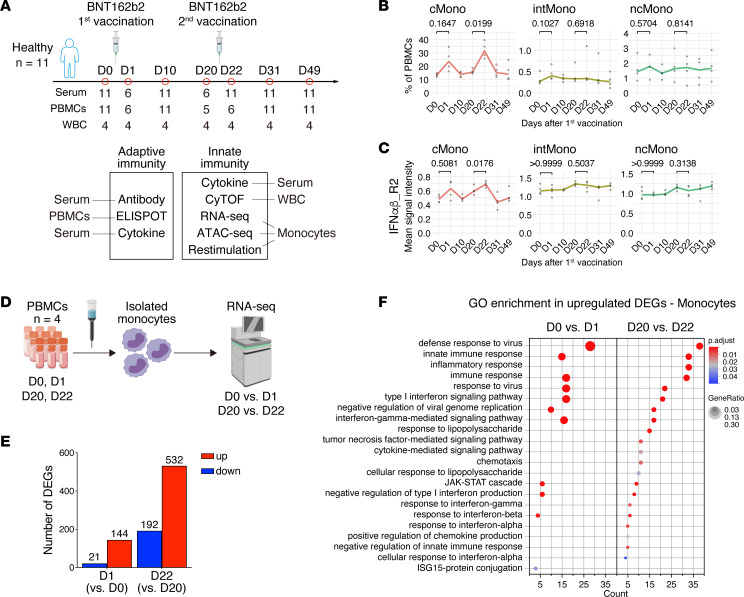
Figure 1. BNT162b2 vaccine alters the innate immune response in monocytes after the first immunization.
(A) Study design and overview of the experiments. Healthy donors (n = 11) enrolled in this study received 2 doses of the BNT162b2 (30 μg/dose) vaccine at 3-week intervals. Blood samples were collected before (D0) and D1, D10, D20, D22, D31, and D49 days after the first vaccination. (B and C) Changes over time in the percentage of monocytes among PBMCs (B) and in the expression of IFNα/β-R2 on cMono, intMono, and ncMono (C). (D) Schematic overview of the RNA-Seq experiment performed using monocytes isolated from PBMCs collected from healthy individuals (n = 4) before and after vaccination (D0, D1, D20, and D22). (E) Numbers of DEGs in isolated monocytes on D1 and D22 compared with D0 and D20 (|log2 fold change| > 1 and Padj < 0.05). (F) Gene Ontology (GO) enrichment analysis of upregulated DEGs in isolated monocytes after BNT162b2 vaccination. All the significantly enriched terms are listed (Padj < 0.05). Left, comparison before (D0) and after (D1) the first vaccination; right, comparison before (D20) and after (D22) the second vaccination. The x axis shows number of genes included in each pathway. The dot color and size represent the statistical significance and the ratio of genes enriched in the pathway to the total enriched genes, respectively. GeneRatio shows the ratio of the number of genes included in each pathway to the total number of upregulated DEGs. WBCs, white blood cells; cMono, classical monocytes; intMono, intermediate monocytes; ncMono, nonclassical monocytes. Statistical analysis was performed using a repeated-measures 1-way ANOVA with a Greenhouse-Geisser correction and a Bonferroni post hoc test (B and C).

