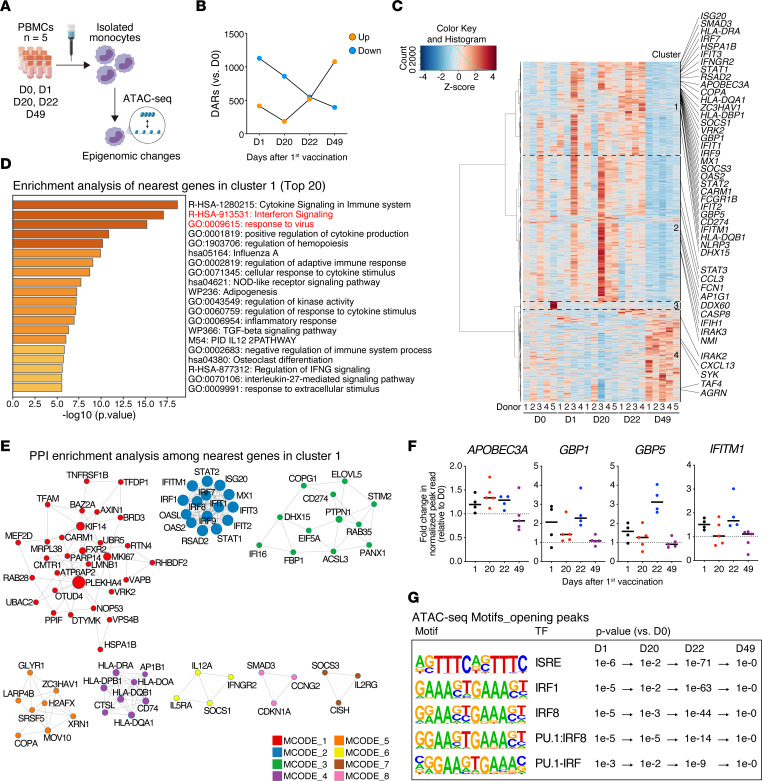
Figure 2. Epigenomic changes in monocytes regulate the innate immune responses to the BNT162b2 mRNA vaccine.
(A) Schematic overview of the ATAC-Seq experiment of monocytes magnetically separated from PBMCs collected from healthy individuals before (D0, n = 5) and after (D1 and D22, n = 4; D20 and D49, n = 5) vaccination. All 4 individuals included in the RNA-Seq analysis (in Figure 1) were included in the ATAC-Seq analysis. (B) Numbers of differentially accessible chromatin regions (DARs) (|log2 fold change| > 1 and P < 0.05) in isolated monocytes on D1, D20, D22, and D49 compared with those on D0 were identified using edgeR (n = 5 per group). (C) Heatmap of Z scores of the normalized read counts identified by ATAC-Seq of isolated monocytes on D0, D1, D20, D22, and D49. Annotated genes were related to the innate immune responses among the nearest genes in each cluster. (D) Enrichment analysis of the nearest genes detected in cluster 1 as conducted with Metascape (http://metascape.org). The top 20 significantly enriched terms are listed (P < 0.05). Innate immune response terms are marked in red. (E) PPI network analysis among the nearest genes in cluster 1 using molecular complex detection algorithm as conducted with Metascape (http://metascape.org). The components of each molecular complex detection (MCODE) are listed in Supplemental Figure 5B. (F) Changes in normalized peak counts nearest antiviral and IFN-stimulated genes identified by ATAC-Seq of isolated monocytes. Fold changes are represented compared with D0. (G) Enriched known motifs identified using hypergeometric optimization of motif enrichment (HOMER) among enhanced chromatin accessibility regions on D1, D20, D22, and D49 compared with those on D0. TF, transcription factor.

