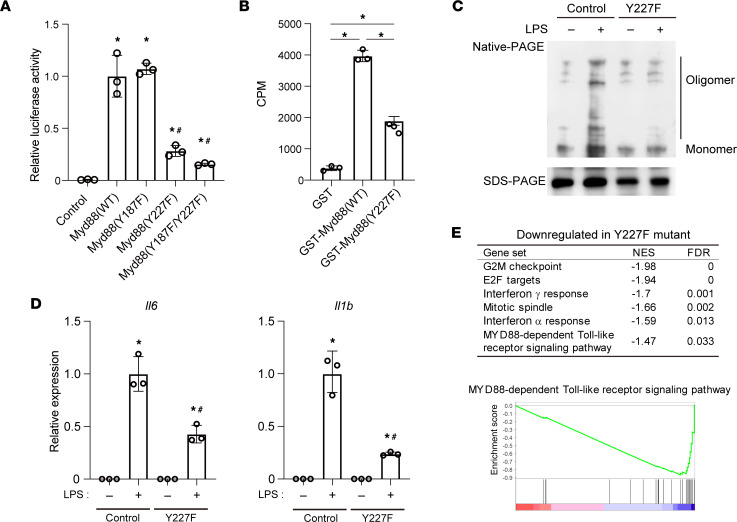
Figure 5. Cholesterol binding to the Myd88 CRAC domain is required for signal amplification.
(A) HEK293T cells were transfected with plasmids encoding WT Myd88 or the indicated Myd88 mutant and a NF-κB motif-driven luciferase reporter plasmid (NFκB-Luc). Luciferase activity was normalized to that of cells transfected with a WT Myd88 expression vector. n = 3/group. *P < 0.05 vs. cells transfected with control plasmid. #P < 0.05 vs. cells transfected with plasmids encoding WT Myd88. Tukey-Kramer post hoc test. Data are representative of 3 independent experiments. (B) Affinity-purified, recombinant GST-tagged Myd88 (WT), Myd88 (Y227F), or GST was incubated with 3H-cholesterol (10 μM) as shown in Figure 4B. GST-Myd88 or GST was recovered, and radioactivity was measured. n = 3. *P < 0.05. Tukey-Kramer post hoc test. (C) Whole-cell lysates were collected from control and Myd88-Y227F mutant RAW cells, stimulated for 4 hours with or without LPS, subjected to Native PAGE, and blotted with an anti-Myd88 antibody. Bands with a slower migration rate correspond to the oligomerized form of Myd88 proteins. A photograph of the same protein run on an SDS-PAGE gel and blotted with anti-Myd88 antibody is shown as a control at the bottom. Data shown are representative of 3 independent experiments. (D) Control and Myd88-Y227F mutant RAW cells were stimulated for 4 hours with LPS, after which expression of Il6 and Il1b was analyzed with qPCR. n = 3/group. *P < 0.05 vs. LPS-untreated control cells, #P < 0.05 vs. LPS-treated control cells. Tukey-Kramer post hoc test. (E) GSEA of MSigDB hallmark gene sets and GO Myd88-dependent TLR signaling pathways. RNA-Seq results for control and Y227F mutant cells stimulated with LPS for 4 hours were used. Shown are the gene sets downregulated (FDR < 0.05) in the Y227F cells. An enrichment plot of Myd88 pathway is also shown. No gene sets were upregulated (FDR < 0.05). Data shown as mean ± SD in all panels where P values are shown.

