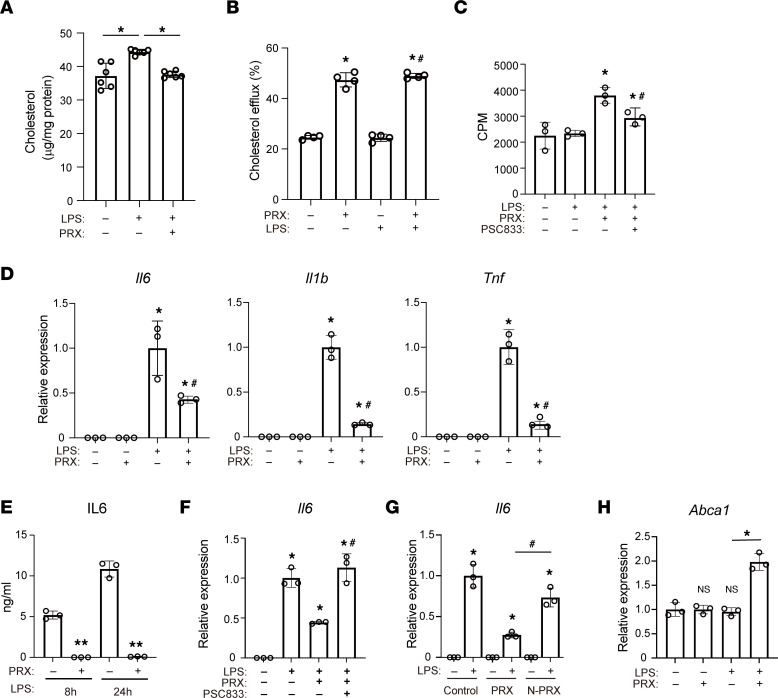
Figure 6. PRX decreases endolysosomal cholesterol.
(A) RAW cells were first treated with or without PRX (2 mM βCD) for 20 hours then with LPS for 4 hours. Cellular cholesterol was quantified with GC/MS (n = 6). *P < 0.05. Tukey-Kramer post hoc test. (B) Effects of PRX on cholesterol efflux. n = 4 in each group. *P < 0.05 vs. untreated cells, #P < 0.05 vs. LPS only–treated cells. Tukey-Kramer post hoc test. (C) Effects of PSC-833 on cholesterol efflux. n = 4. *P < 0.05 vs. untreated cells, #P < 0.05 vs. PRX plus LPS-treated cells, Tukey-Kramer post hoc test. (D) Expression of Il6, Il1b, and Tnf mRNA in RAW cells treated with PRX for 20 hours, followed by LPS stimulation for 4 hours. *P < 0.05 vs. LPS-untreated cells, #P < 0.05 vs. LPS only–treated cells, Tukey-Kramer post hoc test. (E) RAW cells were treated with or without PRX and LPS for the indicated times. IL-6 protein in the conditioned medium was quantified using an ELISA. n = 3 in each group. Data shown are representative of 3 independent experiments. **P < 0.01 vs. PRX-untreated cells at each time point. Student’s 2-tailed t test. (F) RAW cells were treated for 20 hours with PRX and/or PSC-833 prior to 4 hours with LPS. Expression of Il6 mRNA was assessed with qPCR. *P < 0.05 vs. LPS-untreated cells, #P < 0.05 vs. PRX and LPS-treated cells. (G) RAW cells were treated for 20 hours with PRX or N-PRX prior to 4 hours with LPS. Expression of Il6 mRNA was assessed with qPCR. *P < 0.05 vs. LPS-untreated cells, #P < 0.05 vs. PRX and LPS-treated cells, Tukey-Kramer post hoc test. (H) Expression of Abca1 mRNA in RAW cells treated with PRX for 20 hours, followed by stimulation with LPS for 4 hours. *P < 0.05 vs. control cells. Tukey-Kramer post hoc test. Data shown as mean ± SD in all panels where P values are shown.

