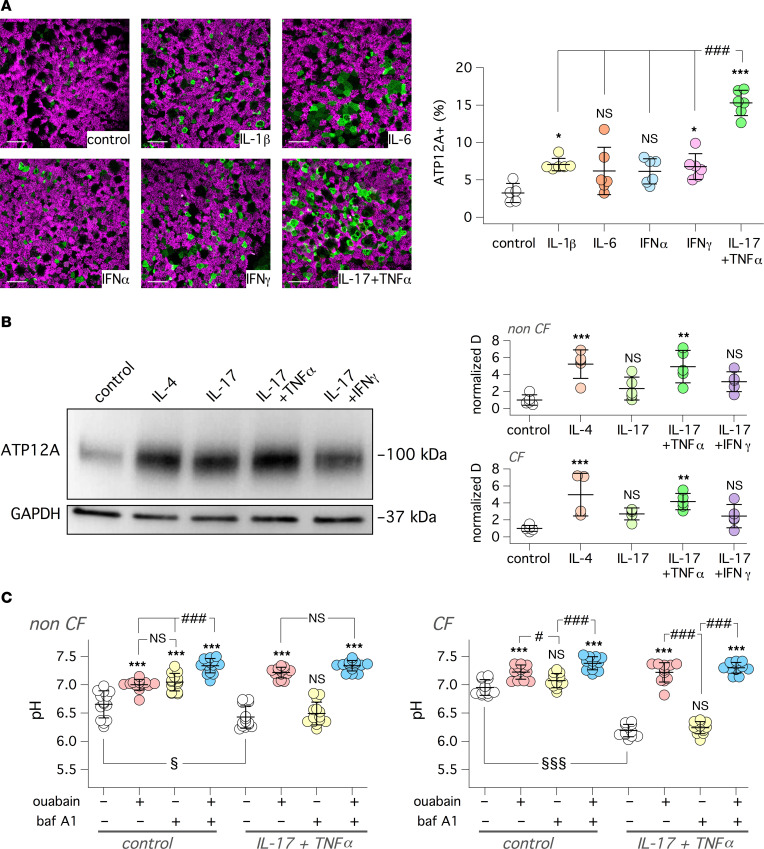
Figure 2. Upregulation of ATP12A expression and function by IL-17/TNF-α in vitro.
(A) Representative confocal microscope images showing detection of ATP12A (green) and acetylated tubulin (i.e., cilia, magenta). Images are xy scans of CF cultured bronchial epithelial cells treated for 72 hours with/without cytokines (10 ng/mL for IL-6, IL-1β, TNF-α, IFN-α, and IFN-γ; 20 ng/mL for IL-17). Scale bar: 25 μm. Scatter dot plot reporting percentage of ATP12A+ cells in bronchial epithelia with indicated treatments (*P < 0.05 and ***P < 0.001 versus control; ###P < 0.001 between indicated conditions; ANOVA and Tukey’s post hoc test). (B) Representative image (left) and summary of data (right) deriving from Western blot analysis of ATP12A protein in lysates of bronchial epithelial cells treated with/without single cytokines or cytokine combinations. The scatter dot plots report the band intensity for ATP12A normalized for GAPDH expression. Data were obtained from 5 CF and 5 non-CF bronchial cell preparations (**P < 0.01 and ***P < 0.001 versus control; ANOVA and Dunnett’s post hoc test). (C) Apical fluid pH measurement with SNARF-1 dextran probe in non-CF and CF bronchial epithelia. Cells were treated with/without IL-17 + TNF-α. Experiments were done in bicarbonate-free conditions. Where indicated, the apical solution contained ouabain (200 μM), bafilomycin A1 (100 nM), or both compounds together. pH was measured after 3 hours of incubation under CO2-free conditions (***P < 0.001 versus control; #P < 0.05 and ###P < 0.001 between indicated conditions; §P < 0.05 and §§§P < 0.001 for treated versus untreated epithelia; ANOVA and Tukey’s post hoc test).

