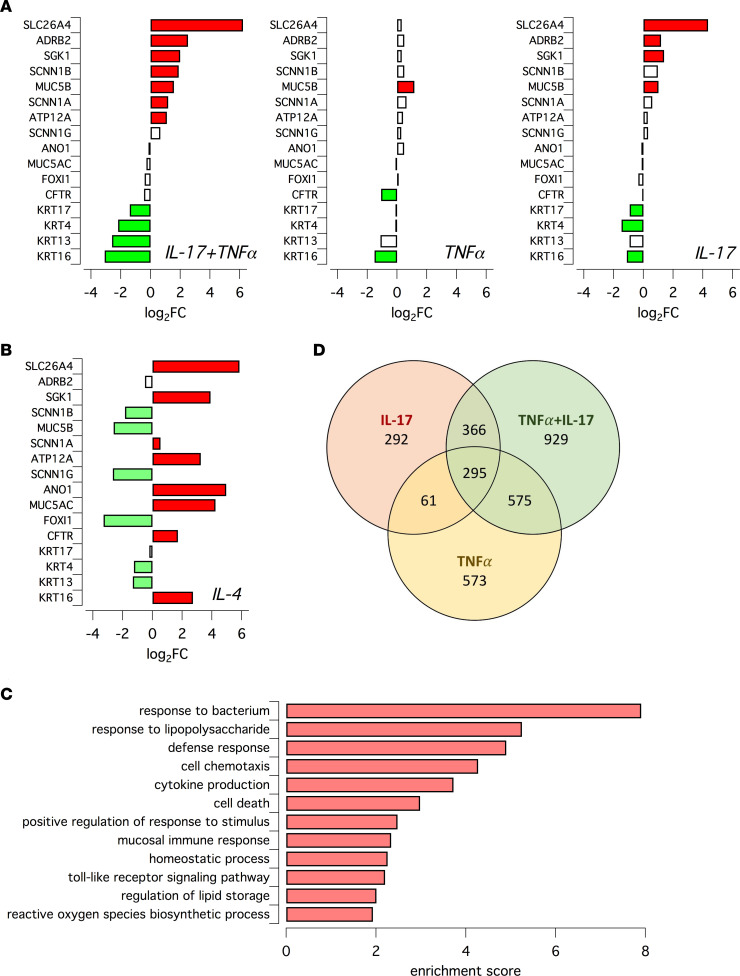
Figure 3. Analysis of gene expression changes in epithelia treated with inflammatory stimuli.
(A and B) Bar graphs reporting the expression changes for indicated genes in epithelia treated with TNF-α + IL-17, TNF-α, IL-17, and IL-4. Data were obtained by RNA-Seq. Red and green indicate statistically significant upregulation and downregulation, respectively. (C) Biological processes which were associated with gene expression changes induced by TNF-α/IL-17 treatment. (D) Venn diagram showing extent of overlap for genes whose expression was upregulated by indicated cytokine treatment.

