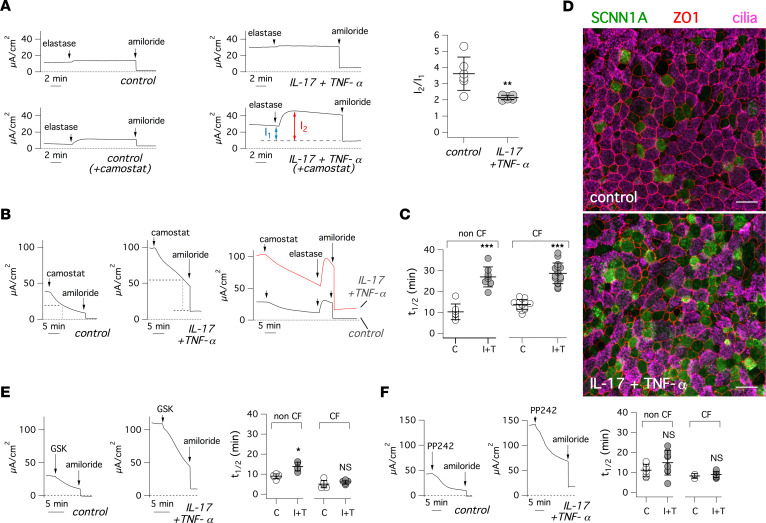
Figure 6. Mechanism of ENaC upregulation by IL-17/TNF-α.
(A) Representative short-circuit current traces (left) and summary of data (right) for experiments on epithelia treated with/without IL-17/TNF-α for 72 hours. During recordings, elastase (1.5 μM) and amiloride (10 μM) were sequentially added. Where indicated, epithelia were apically treated with camostat (3 μM) for 18 hours. The scatter dot plot shows, for experiments with camostat pretreatment, the ratio I2/I1, where I1 and I2 are the current amplitudes before and after elastase, respectively (**P < 0.01; Student’s t test). (B) Representative traces from experiments with/without IL-17/TNF-α treatment in which camostat (3 μM) and amiloride were sequentially added. Where indicated, experiments also included addition of elastase (1.5 μM) after camostat. (C) Summary of data showing the rate of ENaC current decay after camostat addition (C, control; I+T, IL-17/TNF-α). Data (t1/2) report the time at which the current decayed to half of initial amplitude (***P < 0.001; Student’s t test). (D) Representative confocal microscope images, from control- and IL-17/TNF-α–treated epithelia, in which SCNN1A, ZO-1, and cilia were detected by immunofluorescence. Scale bar: 25 μm. (E and F) Representative short-circuit current traces and summary of data for experiments where control- and IL-17/TNF-α–treated epithelia were apically exposed to 25 μM GSK650394 (E) or 5 μM PP242 (F) before amiloride. The scatter dot plots report the t1/2 values for each condition. (*P < 0.05 versus control; Student’s t test).

