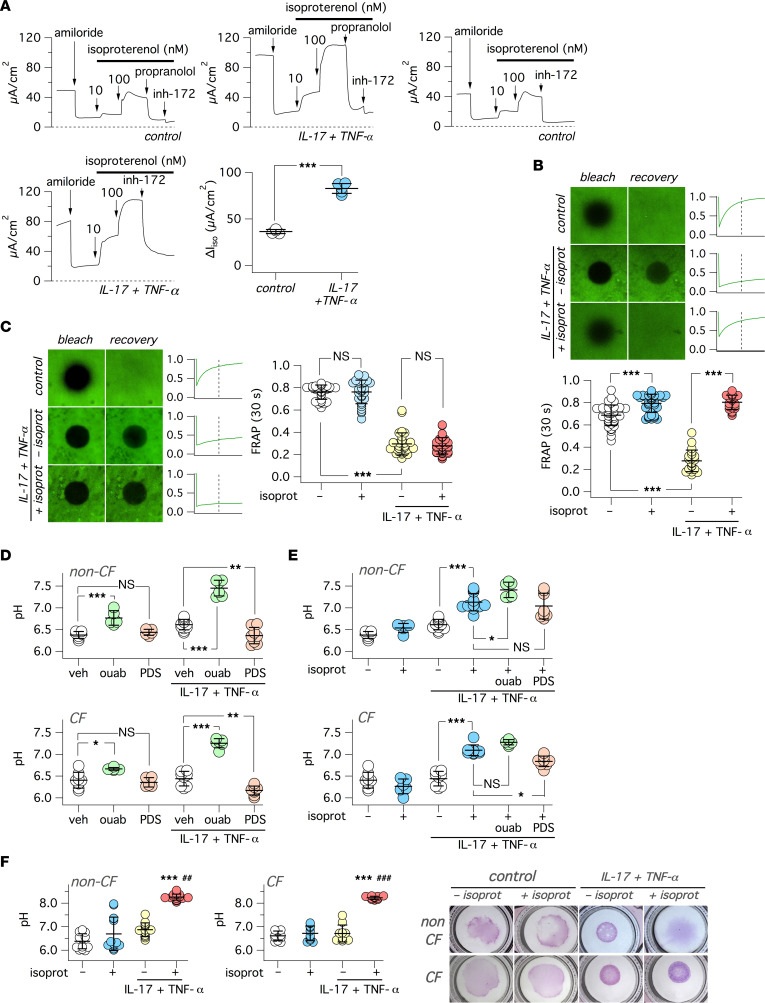
Figure 7. Effect of β-adrenergic stimulus on airway surface properties.
(A) Representative traces and summary of data for short-circuit current experiments on epithelia treated with/without IL-17/TNF-α, in which isoproterenol (10 and 100 nM) was added to stimulate CFTR activity. Where indicated CFTRinh-172 (20 μM) and propranolol (5 μM) were also added. The scatter dot plot shows the amplitude of CFTRinh-172 effect in epithelia previously stimulated with isoproterenol. ***P < 0.001 versus control (Student’s t test). (B and C) Data from FRAP experiments on non-CF (B) or CF (C) epithelia treated with/without IL-17/TNF-α (72 hours). Where indicated, isoproterenol (100 nM) was added for 3 hours on the basolateral side before experiments. Representative images show the epithelial surface, labeled with FITC-dextran, after photobleaching of a circular area and then after a 60-second recovery time. The traces on the side of each image pair report the time course of fluorescence recovery. The vertical dashed line indicates the 30-second time point. Scatter dot plots show the normalized fluorescence value measured at 30 seconds after photobleaching. ***P < 0.001 (Kruskal-Wallis and Dunn’s test). (D and E) Measurement of pH in the apical solution (large volume ex situ pH assay) for non-CF (top) and CF (bottom) epithelia, treated with/without IL-17/TNF-α. Where indicated, the apical solution contained ouabain (ouab, 200 μM) or PDSinh-A01 (PDS, 25 μM), whereas the basolateral solution included isoproterenol (100 nM). *P < 0.5; **P < 0.01; and ***P < 0.001 (ANOVA with Tukey’s post hoc test). (F) Measurement of pH on the apical surface (small volume in situ pH assay) in non-CF and CF epithelia treated with/without IL-17/TNF-α (72 hours). Where indicated, the basolateral solution included isoproterenol (100 nM, for 3 hours before experiment). The scatter dot plots show pH values for the indicated conditions. ***P < 0.001 versus untreated cells (no cytokine treatment, no isoproterenol). ##P < 0.01; ###P < 0.001 versus cells with cytokine treatment/without isoproterenol (Kruskal-Wallis and Dunn’s test). The images show the pattern of SNARF-1 dextran distribution on epithelial surface for the indicated conditions.

