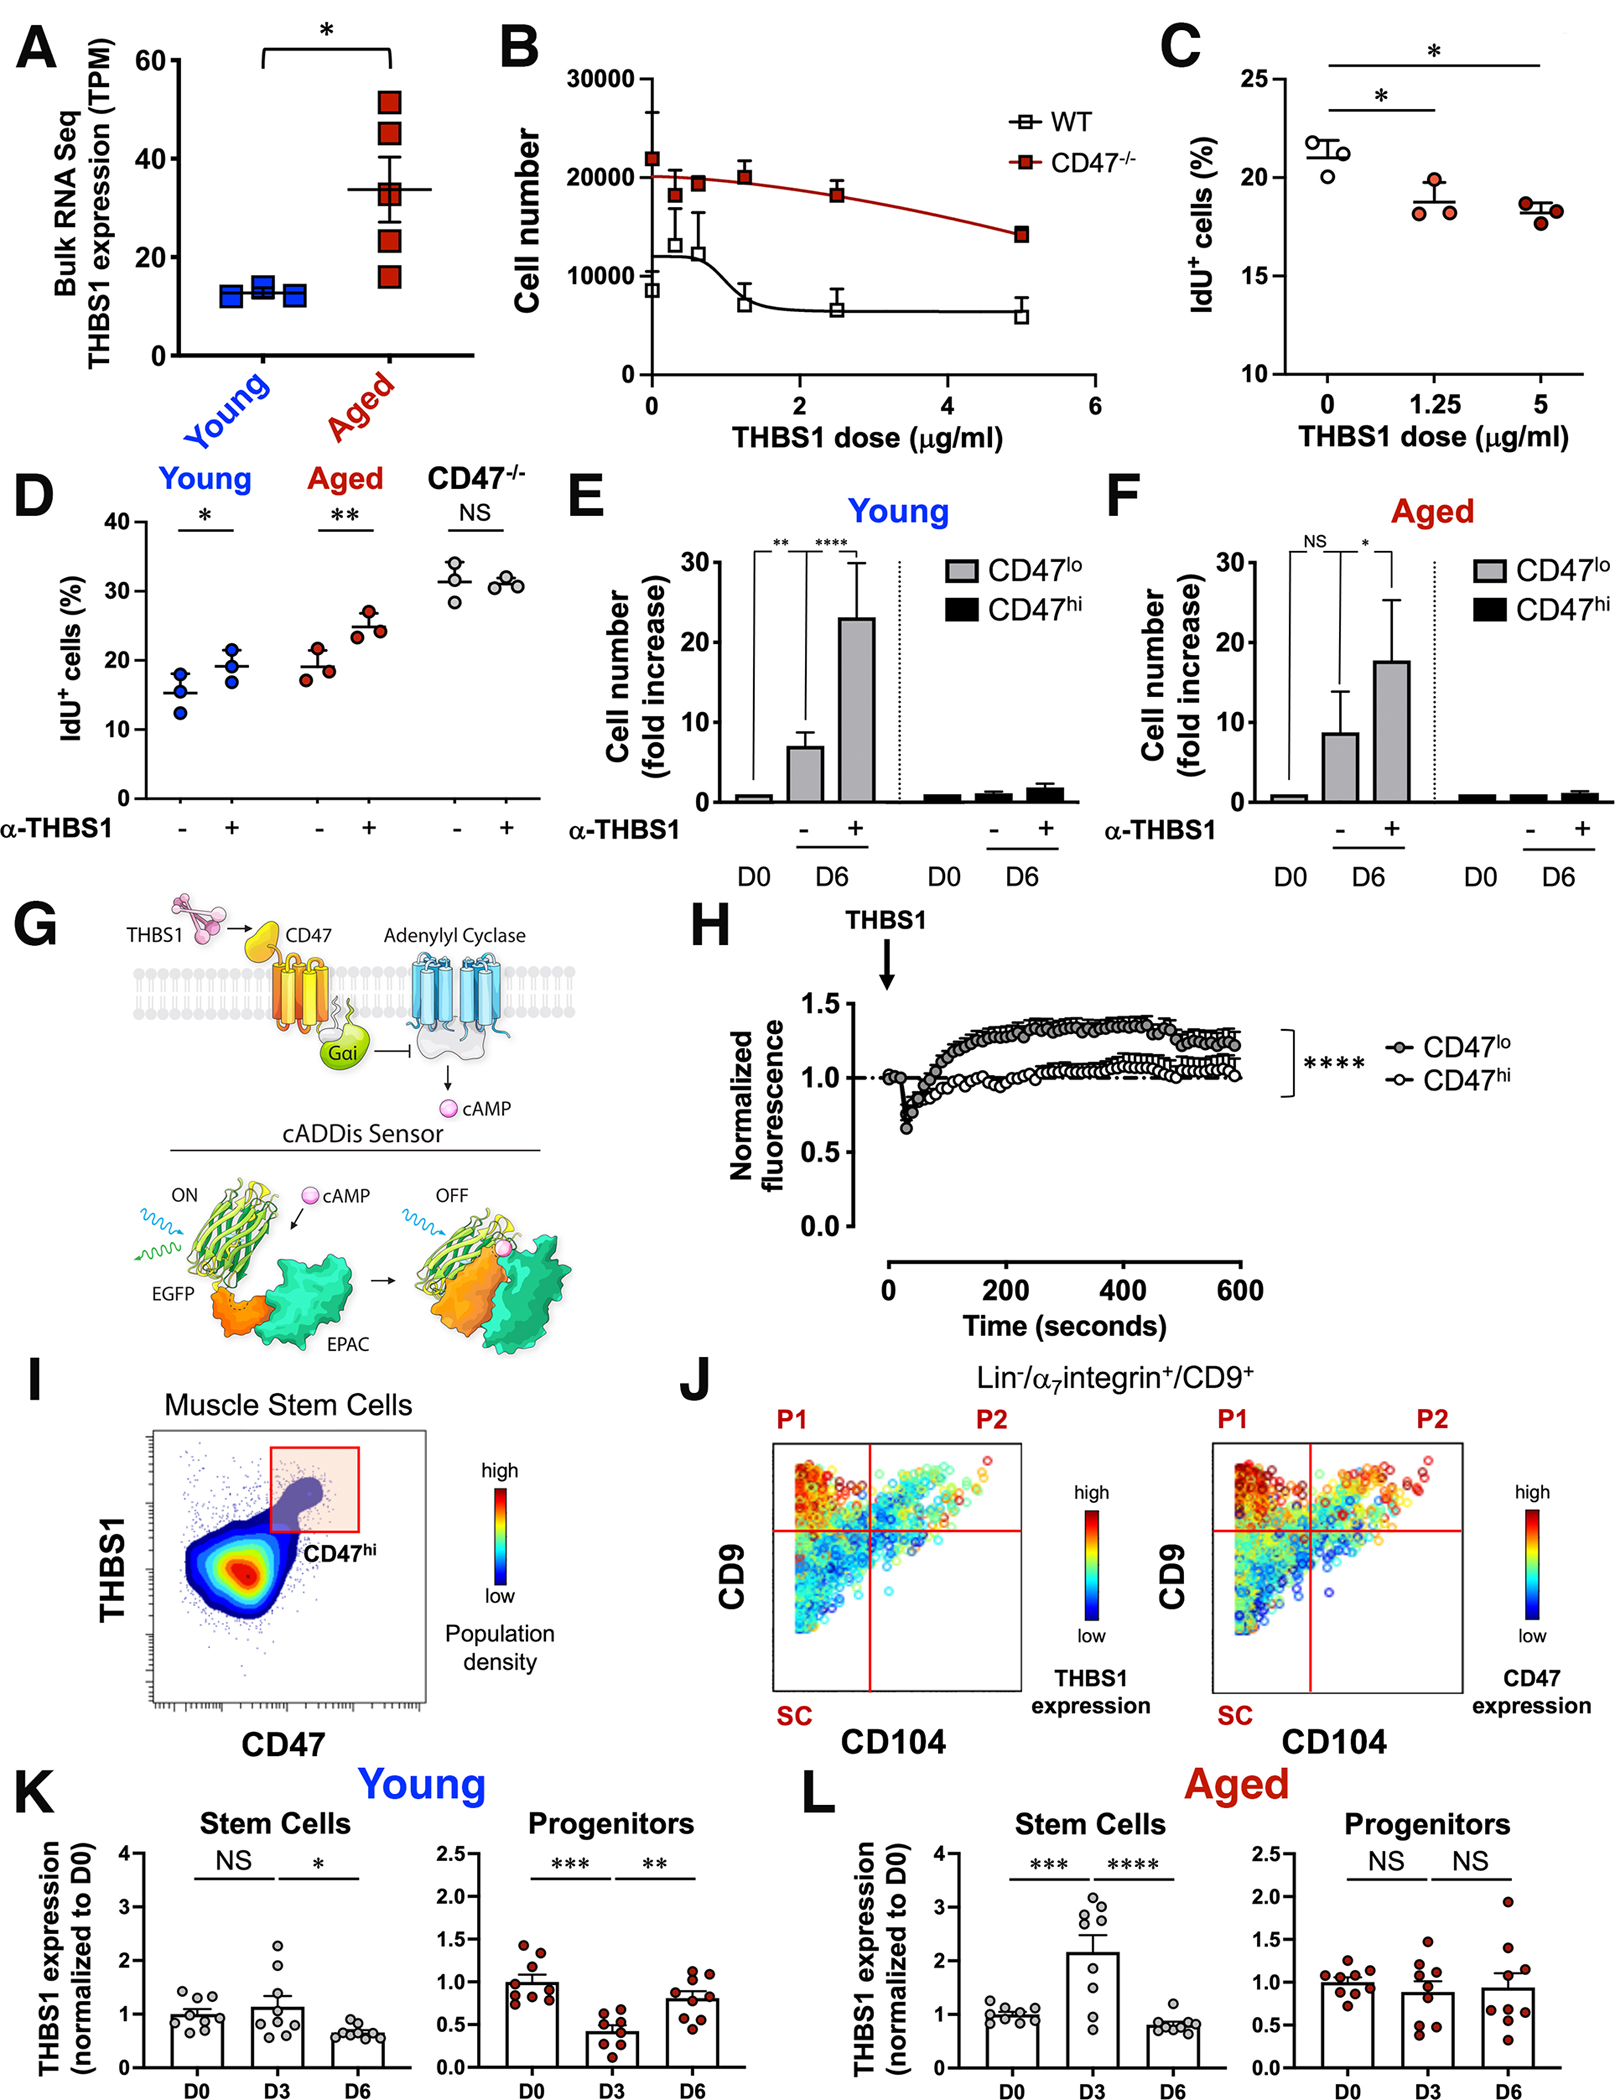
Figure 4. Aberrant thrombospondin-1 signaling via CD47 inhibits the proliferative capacity of aged muscle stem cells.

(A) Scatter plot shows thrombospondin-1 (THBS1) mRNA levels in bulk RNAseq data from young and aged MuSCs (mean ± SEM, n=3 young and 5 aged mice). Two-tailed unpaired t-test analysis with Welch’s correction. (B) Sorted MuSCs from young wild type and CD47−/− mice were treated in vitro with increasing doses of recombinant THBS1 and proliferation was measured by cell count (mean ± SEM, n=14 wild type and 4 CD47−/− replicates, 4 independent experiments). (C) Scatter plot shows the fraction of young IdU+ MuSCs in response to a 6-day in vitro treatment with increasing doses of recombinant THBS1 (mean ± SD, n= 3 young mice). One-way ANOVA analysis with Tukey’s correction for multiple comparisons. (D) Scatter plot shows the fraction of IdU+ MuSCs in response to a 6-day treatment of sorted wild type (young, aged) and CD47−/− aged MuSCs with a blocking antibody to THBS1 (α-THBS1) (mean ± SD, n= 3 mice per genotype). Two-way ANOVA with Sidak’s correction for multiple comparisons. (E, F) CD47lo and CD47hi MuSCs subsets, sorted from young and aged mice, were treated in vitro on biomimetic hydrogels in the presence (+) or absence (−) of a blocking antibody to THBS1 (α-THBS1), and cell number was quantified by cell count at day 0 (D0) or at day 6 (D6) after treatment. Bar graph shows cell number normalized to D0 for each subset (mean ± SEM from n= 7 young and 3 aged replicates). Two-way ANOVA analysis with Tukey’s correction for multiple comparisons. (G) (Top scheme) THBS1–CD47–cAMP signaling axis. THBS1–CD47 signals through Guanine nucleotide-binding protein Gi’s alpha subunit which inhibits adenylyl cyclases to reduce cAMP levels. (Bottom scheme) The cADDis downward sensor detects changes in cAMP concentration in living cells. cAMP binding to the cADDis downward sensor reduces GFP fluorescence. (H) Sorted CD47lo and CD47hi young MuSCs, transduced with a baculovirus encoding the cAMP sensor, were treated with THBS1 and individually imaged with a confocal microscope for 5 minutes at 10 sec intervals. The graph shows the average normalized GFP fluorescence of CD47lo and CD47hi MuSCs over time (mean ± SEM, 4 mice, 2 independent experiments). Two-tailed paired t-test analysis. (I, J) CyTOF analysis of young hindlimb muscle. (I) Representative contour plot of THBS1 (y axis) by CD47 (x axis) colored by population density shows a CD47hi MuSC subset that expresses high levels of THBS1. (J) Representative biaxial dot plots of CD9 (y axis) by CD104 (x axis) colored by channel show the expression of THBS1 (left) and CD47 (right) in stem (SC) and progenitor cells (P1, P2). (K, L) Intracellular THBS1 protein measurement by CyTOF during an injury time course. Bar graphs show THBS1 levels at day 3 (D3) and day 6 (D6) post injury, normalized to day 0 (D0), in SC (left) and P1 (right) population from young (K) and aged (L) mice (mean ± SEM, n=9 mice from 2 independent experiments). One-way ANOVA analysis with Tukey’s correction for multiple comparisons.
