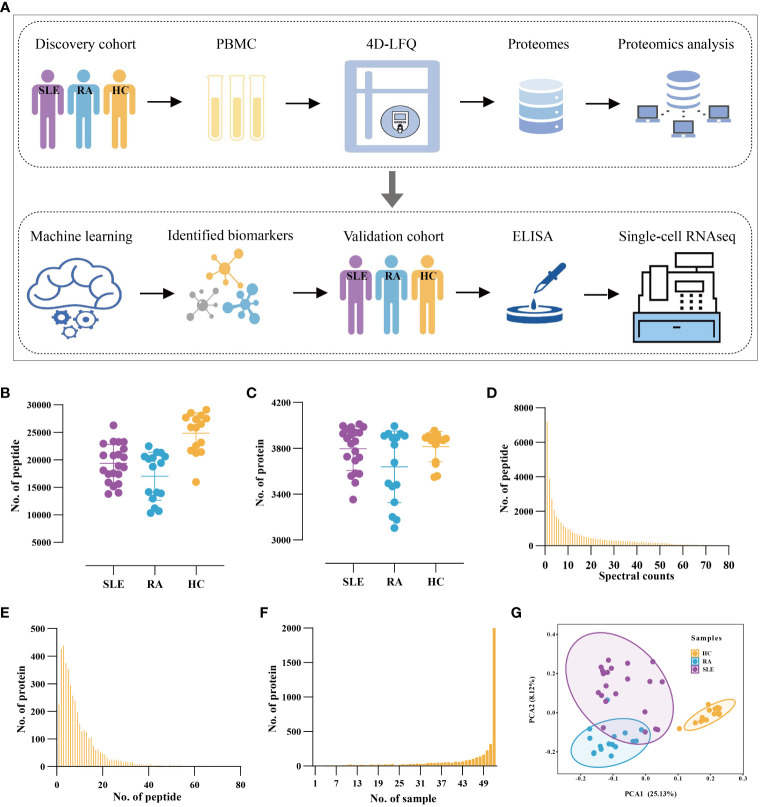
Figure 1.
Proteomic Profiling of PBMC from SLE and RA patients and Health Volunteers. (A) The workflow of the study. All PBMC samples were used for 4D-LFQ proteomics analysis and ELISA analysis. (B, C) The distribution of numbers of quantified (B) peptides and (C) proteins in the 52 PBMC samples from three groups. Color dots represent multiple independent samples, SLE (n = 21), RA (n = 16), HC (n = 15). (D) The distribution of MS/MS spectral counts of quantified peptides. (E) The distribution of peptide numbers of quantified proteins. (F) The distribution of protein numbers in PBMC samples. (G) PCA of proteomic data in HC, SLE, and RA.

