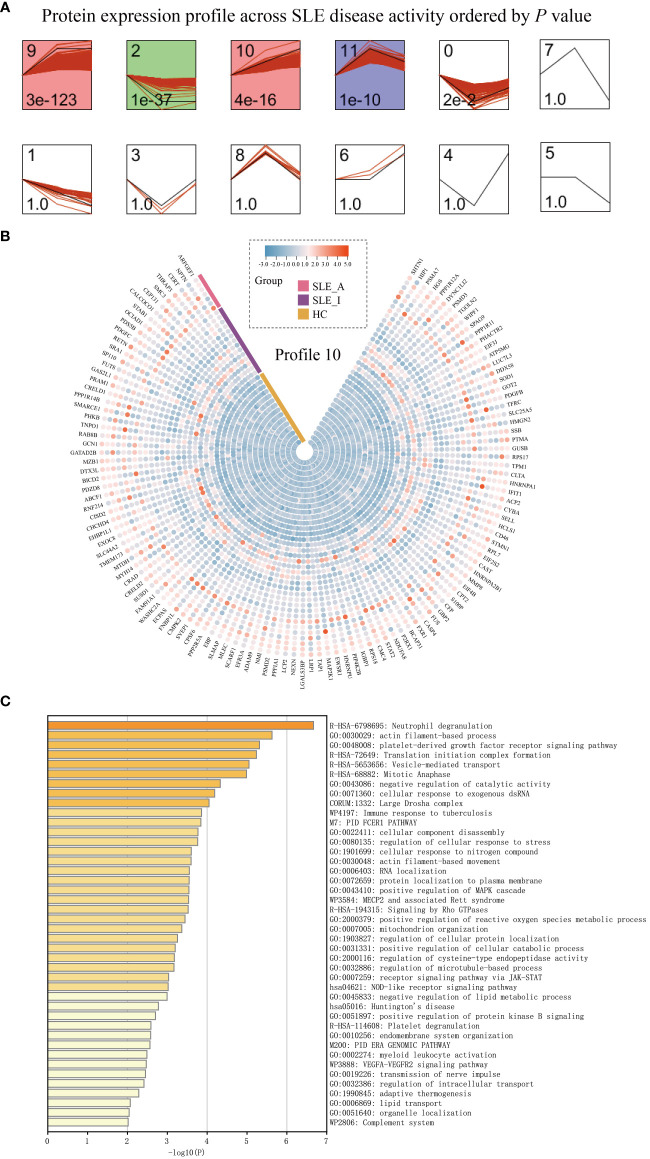
Figure 3.
PBMC proteomic data for SLE disease exacerbation. (A) PBMC proteomics profiles of STEM analysis. STEM analysis was applied to obtain the protein expression profiles across HC, SLE_I, and SLE_A. Profile ID was shown at the top left corner of the profile, and significance (P value) was shown at the bottom left corner of the profile. Red lines in each profile represent the expression pattern of proteins across HC, SLE_I, and SLE_A (permutation test, P < 0.05). (B) Heatmap for the expression of proteins in profile 10 along with disease exacerbation. (C) The function analysis of profile 10 in Metascape platform (P < 0.01).

