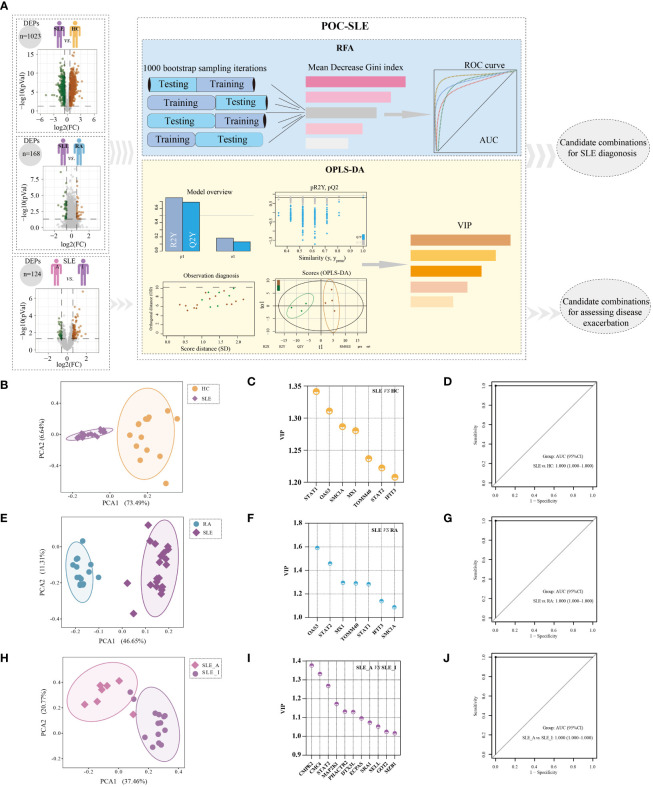
Figure 4.
Identification of potential biomarker combinations for the disease diagnosis and assessing disease exacerbation of SLE patients. (A) The workflow of POC-SLE, including 1000 bootstrap sampling iterations RFA and OPLS-DA. The PCA plot for distinguishing SLE and HC (B), SLE and RA (E), and SLE_A and SLE_I (H). The VIP value of potential biomarker combinations for discriminating SLE and HC (C), SLE and RA (F), SLE_A and SLE_I (I). ROC curve of the biomarker combination for disease diagnosis to differentiate SLE and HC (D), SLE and RA (G); ROC curve of the biomarker combination for assessing disease exacerbation to distinguish SLE_A and SLE_I (J).

