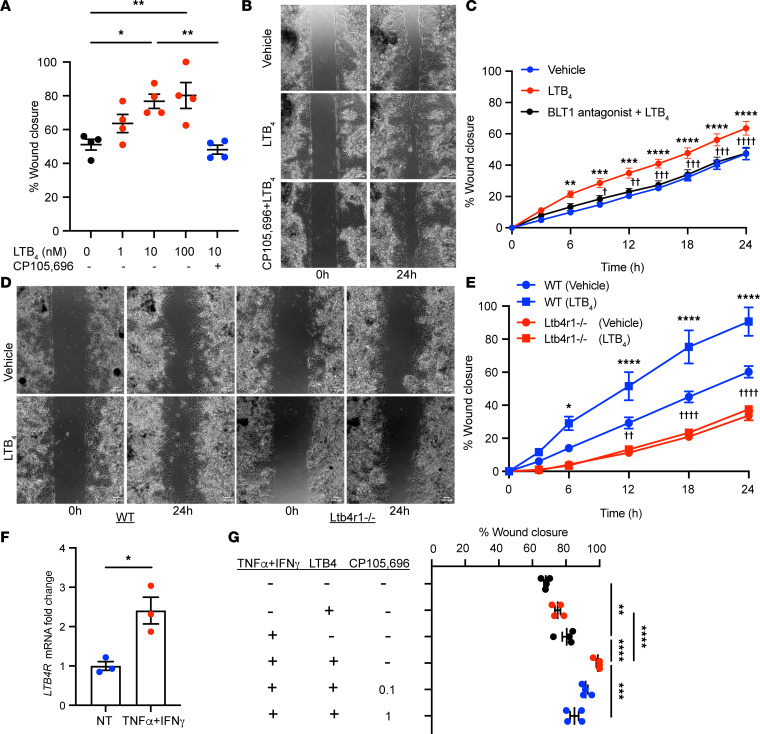
Figure 3. BLT1 regulates intestinal epithelial wound repair.
(A) Effect of LTB4 in the scratch wound assay using SKCO-15 cells. The data are presented as the mean ± SEM. Statistical analysis was performed using 1-way ANOVA followed by post hoc Welch’s t test with Bonferroni’s correction. *P < 0.05; **P < 0.01. (B and C) Effect of LTB4 in the scratch wound assay using human primary colonic epithelial monolayers. (B) Representative phase-contrast images at 0 and 24 hours after wounding are shown. Scale bar is 100 μm. (C) Quantification of change over time in wound repair is shown. The data are presented as the mean ± SEM. Statistical analysis was performed using 2-way ANOVA followed by post hoc Welch’s t test with Bonferroni’s correction. **P < 0.01; ***P < 0.001; ****P < 0.0001, compared with vehicle. †P < 0.05; ††P < 0.01: †††P < 0.001; ††††P < 0.0001, compared with LTB4. (D and E) Effect of LTB4 in the scratch wound assay using primary epithelial monolayers. (D) Representative phase-contrast images at 0 and 24 hours after wounding are shown. Scale bar is 100 μm. (E) Quantification of change over time in wound repair is shown. The data are presented as the mean ± SEM. Statistical analysis was performed using 2-way ANOVA followed by post hoc Welch’s t test with Bonferroni’s correction. *P < 0.05; ****P < 0.0001, compared with WT (vehicle). ††P < 0.01; ††††P < 0.0001, compared with Ltb4r1–/– (vehicle). (F) qPCR analysis of the changes in the expression of LTB4R mRNA in the human 2D cultured colonoid stimulated with IFN-γ (10 ng/mL) and TNF-α (10 ng/mL). The data are presented as the mean ± SEM. Statistical analysis was performed using an unpaired (2-tailed) t test with Welch’s correction. *P < 0.05. NT, nontreated. (G) Effect of IFN-γ (100 ng/mL) and TNF-α (100 ng/mL) on the prorepair activity of low-dose LTB4 (1 nM) in the scratch wound assay using SKCO-15 cells. The data are presented as the mean ± SEM. Statistical analysis was performed using 1-way ANOVA followed by post hoc Welch’s t test with Bonferroni’s correction. **P < 0.01; ***P < 0.001; ****P < 0.0001.

