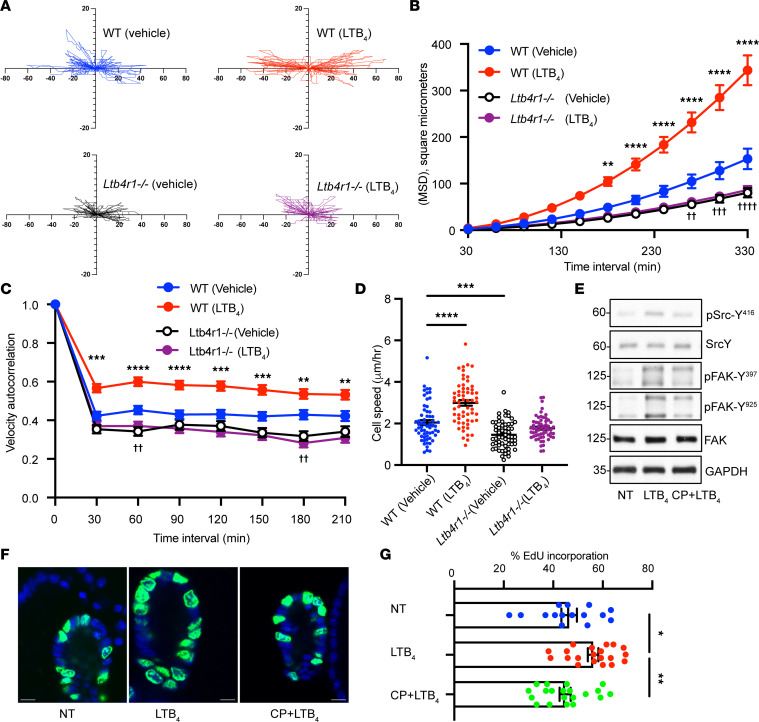
Figure 4. BLT1 activation promotes migration and proliferation of IECs.
(A–D) Migration analysis by DiPer. (A) Plot at the origin graph of 20 cells. (B) Mean square displacement of 20 cells. The data are presented as the mean ± SEM. Statistical analysis was performed using 2-way ANOVA followed by post hoc Welch’s t test with Bonferroni’s correction. **P < 0.01, ****P < 0.0001, compared with WT (vehicle). ††P < 0.01, †††P < 0.001, ††††P < 0.0001, compared with Ltb4r1–/– (vehicle). (C) Velocity autocorrelation was measured on at least 20 cells. Statistical analysis was performed using 2-way ANOVA followed by post hoc Welch’s t test with Bonferroni’s correction. **P < 0.01, ***P < 0.001, ****P < 0.0001, compared with WT (vehicle). ††P < 0.01, compared with Ltb4r1–/– (vehicle). (D) Average cell speed was calculated on 20 cells. The data are presented as the mean ± SEM. Statistical analysis was performed using 1-way ANOVA followed by post hoc Welch’s t test with Bonferroni’s correction. ***P < 0.001, ****P < 0.0001. (E) Immunoblotting was performed on lysates from scratch-wounded IEC monolayers treated with LTB4 (100 nM) or vehicle. Levels of phosphorylated SRC (p-SRC) (Y416) and p-FAK (Y397, Y925) were compared with total Src, FAK, and GAPDH to assess activation. Numbers on the left represent kDa. (F and G) EdU incorporation analysis in murine 3D cultured colonoids stimulated with LTB4 (10 nM) for 24 hours. (F and G) Effect of BLT1 antagonist. Pictures show representative images of EdU-incorporated (shown in green) colonoids. Blue, nuclei. Scale bar is 10 μm. The data are presented as the mean ± SEM. Statistical analysis was performed using 1-way ANOVA followed by post hoc Welch’s t test with Bonferroni’s correction. *P < 0.05, **P < 0.01.

