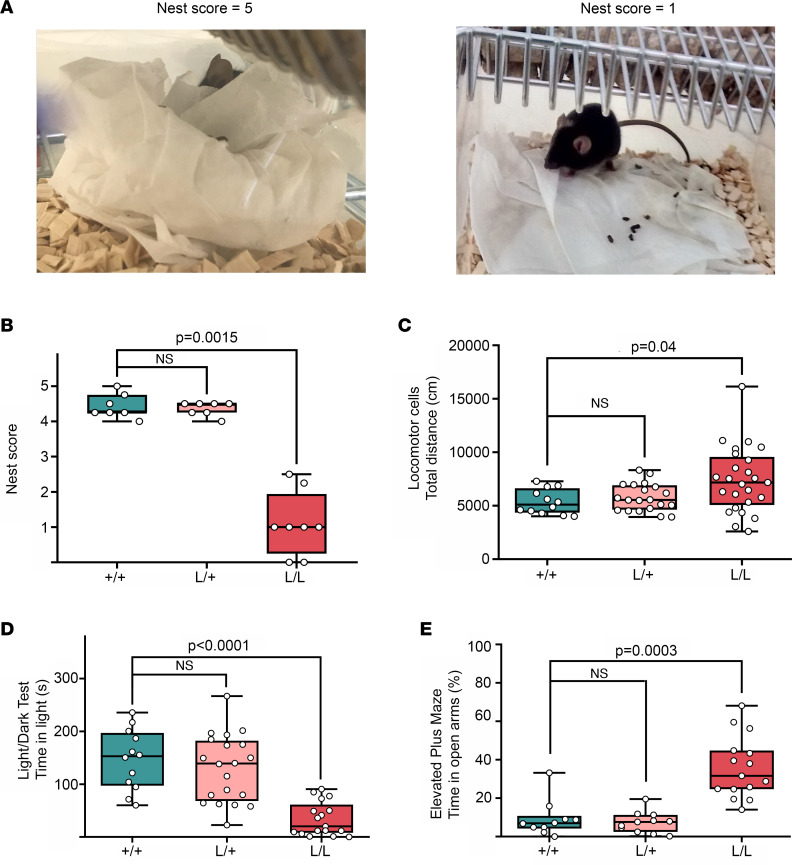
Figure 2. Behavioral profile of the Kcnt1 L/L mouse model.
(A) Representative images of minimal and maximal scores of nesting behavior. The left image corresponds to a score of 5 (+/+ mouse), while the right image exemplifies a score of 1 (L/L mouse). (B) Nesting behavior is impaired in L/L mice (+/+ n = 7, L/+ n = 7, L/L n = 8, Kruskal-Wallis test with Dunn’s post hoc analysis). (C) Total ambulatory distance explored in the locomotor cells test. L/L mice are more active compared with L/+ and +/+ (+/+ n = 12, L/+ n = 20, L/L n = 25, Kruskal-Wallis test with Dunn’s post hoc analysis). (D) L/L mice spend less time in the light compartment during the light/dark box test (+/+ n = 12, L/+ n = 20, L/L n = 17, Kruskal-Wallis test with Dunn’s post hoc analysis). (E) L/L mice display a preference for the open arms of the elevated plus maze (+/+ n = 10, L/+ n = 11, L/L n = 15, Kruskal-Wallis test with Dunn’s post hoc analysis). Data are presented in a box-and-whisker plot with maximal and minimal data points (whiskers) and median (line).

