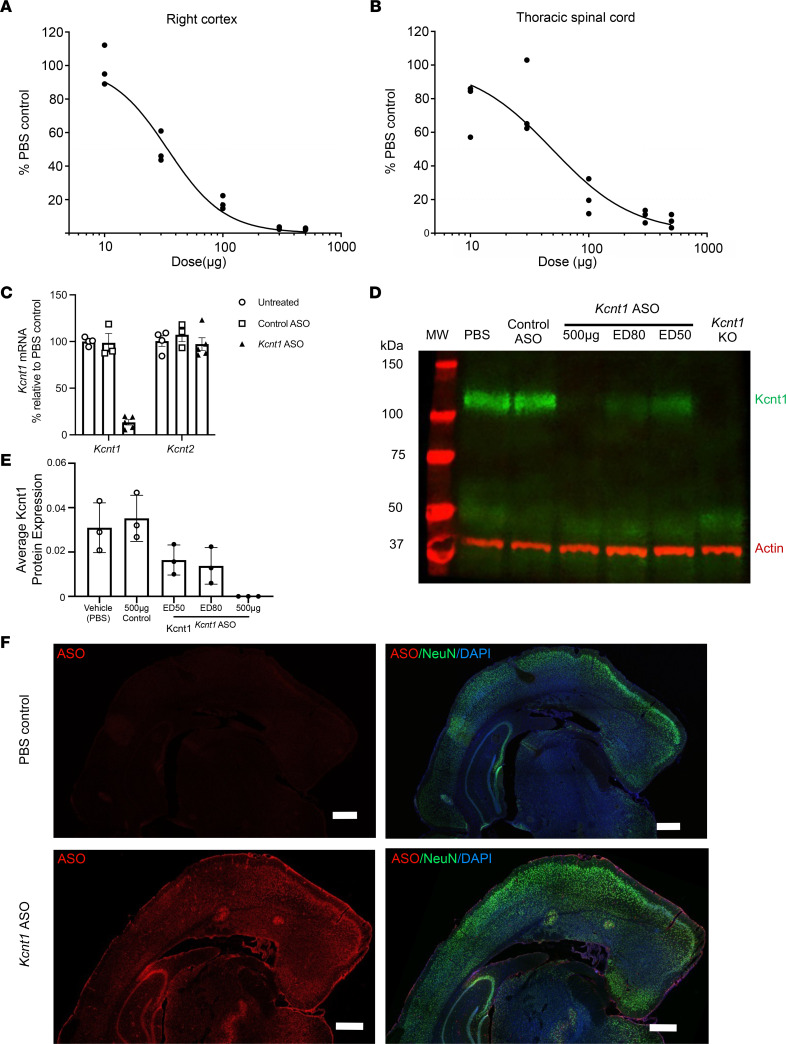
Figure 3. Kcnt1 ASO produces a dose-dependent knockdown of Kcnt1 mRNA in the mouse CNS.
Dose-response curves for Kcnt1 ASO in the brain cortex (A) and thoracic spinal cord (B) for +/+ mice injected at P40. The tissue was collected 2 weeks after injection and processed for mRNA quantification (n = 3 for each dose and PBS control, curves were fitted with the Motulsky regression). (C) Mouse cortex was collected 2 weeks after i.c.v. injection for mRNA quantification. The i.c.v. administration of Kcnt1 ASO reduced the levels of Kcnt1 mRNA (Kruskal-Wallis test P = 0.0027), without affecting the paralog gene Kcnt2 (Kruskal-Wallis test P = 0.4794); data are presented as bar plots with mean and SEM, untreated n = 4, Kcnt1 ASO n = 5, control ASO n = 3. (D) Western blot showing a reduction of Kcnt1 protein in WT mice left hemisphere 2 weeks after i.c.v. injection. (E) Average band signal for Kcnt1 protein. Data are presented as bar plots with mean and SD (n = 3 mice for each treatment condition, NS for all comparisons except PBS versus 500 μg, 1-way ANOVA with Dunnett’s multiple comparisons test). (F) Distribution of the Kcnt1 ASO in the mouse brain. Coronal brain sections of +/+ mice treated with Kcnt1 ASO 75 μg. Tissue was collected 2 weeks after i.c.v. injection and stained with an ASO antibody (red) and neuronal marker (NeuN; green) and counterstained with nuclear stain DAPI (blue). Kcnt1 ASO was found throughout the meninges, hippocampus, and cortical layers (n = 3 experiments). Scale bars represent 500 μm.

