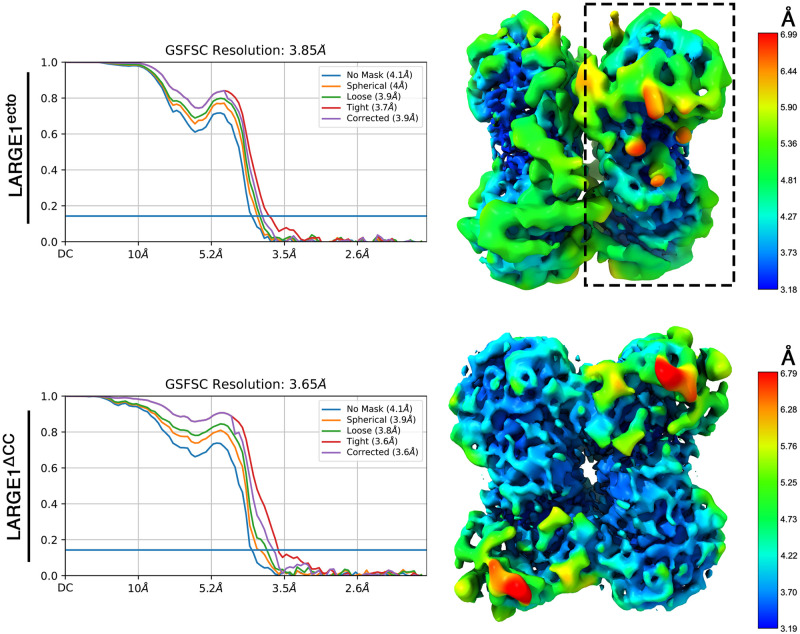
Fig 2. Single particle cryo-EM maps of LARGE1.
Reconstructed maps of the LARGE1ecto (upper part) and LARGE1ΔCC (lower part). The gold standard FSC curves are shown on the left and density maps colored by the local resolution estimates are shown on the right. One half map that was used as a molecular replacement model is highlighted with a dashed rectangle.

