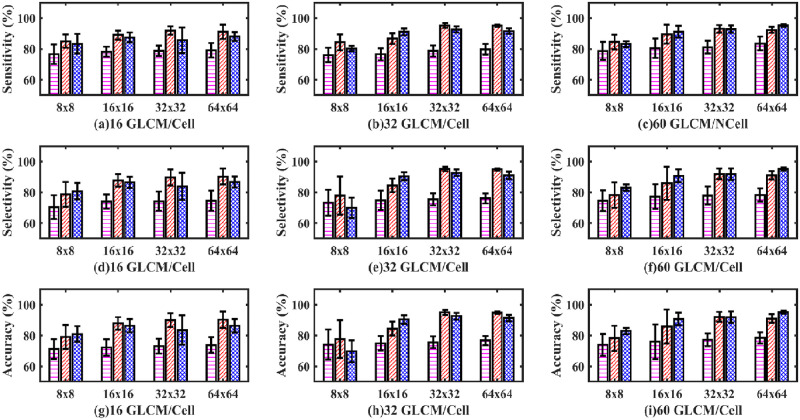
Fig 8. Sensitivity, selectivity, and accuracy bar plots of an SLP classifier.
Sensitivity (a, b, c), selectivity (d, e, f) and accuracy (g, h, i) bar plot of an SLP classifier. (Magenta dashed bar, standard method; Red slashed bar, GM-GLCM image training; Blue crossed bar, GD-GLCM image training method. The x-axis defines the size of GLCM arrays passed to the SLP network (namely, 8×8, 16×16, 32×32 and 64×64). The caption label defines how many GLCMs arrays were passed to the SLP network for training/cell (namely 16,32 or 60).

