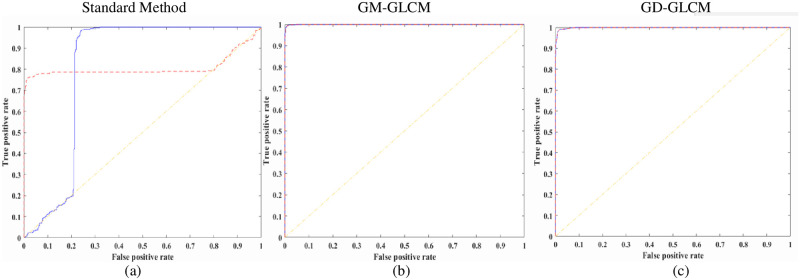
Fig 15. ROC curves for healthy and dying cells of two hidden layer MLP classifier.
Average ROC curves for healthy and dying cells using the optimised 32 GLCMs/cell category and GLCM size of 64×64 for the two hidden layer MLP classifier (Red dashed line–healthy cells; Blue solid line–dying cells). (a) using standard method with 64×64 GLCM size, (b) using GM-GLCM with 64×64 GLCM size, (c) using GD-GLCM with 64×64 GLCM size.

