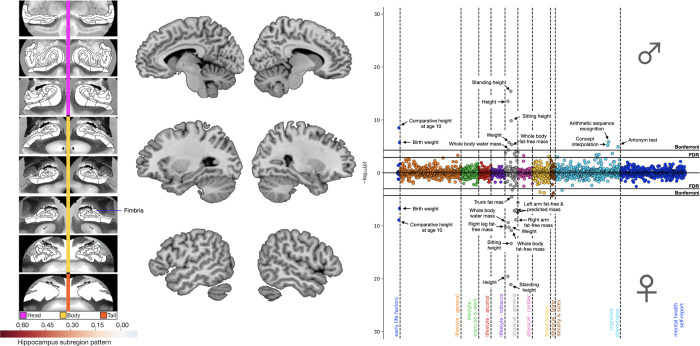
Fig 3. APOE associations for mode 8 linked lipid metabolism to deviation of the fimbria.
Shown here are ADRD-related subregion divergences for mode 8 for the HC (leftmost panel) and DN (central panel). We identified a focalized divergence to the fimbria with no corresponding DN hits. In males and females separately, we regressed APOE dosage on HC and DN co-variation patterns from mode 8. We then used these sex-specific models to predict APOE dosage based on inter-individual expressions of mode 8. The rightmost panel displays the Miami plot for the correlations between APOE scores in the context of mode 8 and the portfolio of UKB phenotypes for males (upper half) and females (lower half). We show associations with phenotypes related to lipid metabolism and height, supplemented by male-specific associations with the fluid intelligence battery. Data underlying this figure can be found at https://github.com/dblabs-mcgill-mila/HCDMNCOV_AD/tree/master/Miami_Plots (DOI: 10.5281/zenodo.7126809). ADRD, Alzheimer’s disease and related dementia; APOE, Apolipoprotein E; DN, default network; FDR, false discovery rate correction; HC, hippocampus.

