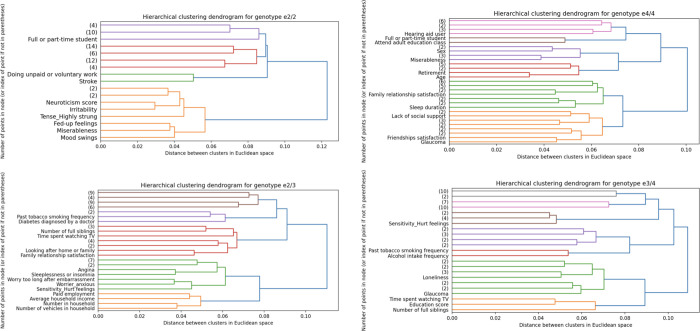
Fig 4. Neuroticism-related phenotypes show unique risk-anatomy links in ɛ2 carriers.
To test for risk-anatomy links, we computed the Spearman’s correlations between the population-wide HC and DN co-variation patterns, multiplied by each of the 6 APOE genotypes and the 63 preselected Alzheimer’s disease risk factors [34]. We performed an agglomerative clustering analysis on these Spearman’s correlations, which consists of repeatedly merging Spearman’s correlations with similar variance until all observations are merged into a single cluster. Here are shown the dendrograms that indicate the distance between each cluster identified when retaining 3 levels of branching for APOE ɛ2/2 (upper left; N = 217), ɛ2/3 (lower left; N = 4,625), ɛ4/4 (upper right; N = 822), ɛ3/4 (lower right; N = 8,613). The dendrograms for ɛ3/3 and ɛ2/4 can be found in the Supporting information (S12 Fig). We showed the early emergence of social engagement phenotypes (e.g., doing unpaid or voluntary work, attending adult education classes, family relationship satisfaction, number of people in household, and number of full siblings) across the different APOE gene variants suggesting that the contribution of social behaviours to risk-anatomy links transcend genetic risk. Ɛ3 carriership was characterised by the early branching of socioeconomic determinants (e.g., paid employment, average household income, number of vehicles in the household, time spent watching TV, and education score) as shown on the dendrograms for ɛ2/3, ɛ3/4, and ɛ3/3 (S12 Fig). While clusters of social engagement and socioeconomic determinants were shared across different APOE genotypes, we found that neuroticism was uniquely associated with ɛ2 carriership. Indeed, the dendrogram for ɛ2/2, ɛ2/3, and ɛ2/4 (S12 Fig) showed an early emerging cluster of neuroticism-related phenotypes (e.g., irritability, miserableness, being worried/anxious). This personality cluster was especially apparent for ɛ2 homozygotes, as reflected by the relatively high Euclidean distance of the first branching that split the neuroticism-related phenotypes from the rest of the risk factors. Data underlying this figure can be found at https://github.com/dblabs-mcgill-mila/HCDMNCOV_AD/tree/master/clustering_analysis (DOI: 10.5281/zenodo.7126809). APOE, Apolipoprotein E; DN, default network; HC, hippocampus.

